


Zinger Key Points
- Tesla's stock faces strong bearish pressure, exacerbated by concerns over China production and Cybertruck resale value.
- Technical indicators, including moving averages, MACD, RSI and Bollinger Bands, suggest a challenging period ahead.
- Today's manic market swings are creating the perfect setup for Matt’s next volatility trade. Get his next trade alert for free, right here.
Amidst the electric vehicle revolution, Tesla Inc TSLA has long been considered a trailblazer, but recent developments have cast shadows over its once bright trajectory.
The company’s stock has witnessed a significant decline of -12.5% over the past year; a rough -30% year-to-date performance, leaving investors concerned about its future direction.

Recent reports highlighted troubles within Tesla’s China operations, suggesting a potential slowdown in production. This revelation has sent ripples through the market, leading to pre-market trading dips and subsequent declines in Tesla’s share price.
Related: Why Tesla Stock Is Sinking Over 3% Premarket Today
Amidst these concerns, rumors of production cuts in China have reignited worries about the company’s ability to meet delivery targets, further dampening investor sentiment.
Adding to the woes, the resale market for Tesla’s highly anticipated Cybertruck has experienced a significant downturn. Just a few weeks ago, the vehicle was fetching prices nearly double its original value. However, recent reports indicated a sharp drop in resale value, with sellers struggling to turn a profit. This sudden decline in demand raises questions about consumer interest in Tesla’s latest offerings and the company’s pricing strategy.
The decline in Tesla’s stock price and the challenges facing its production and resale markets have prompted investors to turn to technical analysis for insights into its future trajectory.
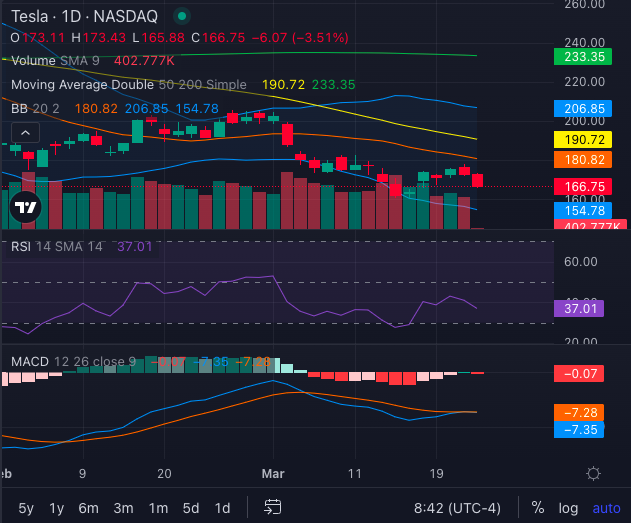
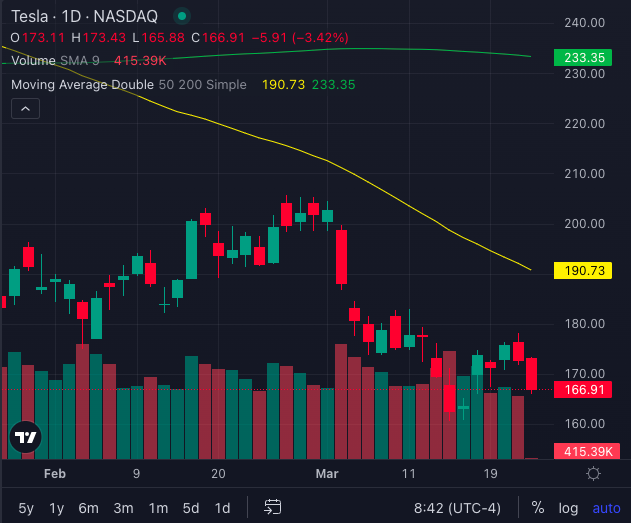
Technical Indicators Point To A Bearish Outlook For Tesla Stock
A closer look at the technical indicators reveals a bearish outlook for the stock.
Tesla’s share price has fallen below its 5-, 20-, and 50-day moving averages, signaling a strong bearish trend. This downward momentum suggests selling pressure, indicating the possibility of further declines in the stock’s value.
Furthermore, technical indicators such as the Moving Average Convergence Divergence (MACD), Relative Strength Index (RSI) and Bollinger Bands confirm the bearish sentiment surrounding Tesla’s stock. The MACD indicator stands at -7.28 (orange line in chart above), suggesting a sell signal, while the RSI (purple line above) at 37.01 indicating oversold conditions.
The Bollinger Bands also suggest sell signals, with both the 25-day and 100-day ranges indicating downward pressure on the stock’s price.
Read Next: Top 5 Consumer Stocks That May Crash This Month
Photo: Shutterstock
Edge Rankings
Price Trend
© 2025 Benzinga.com. Benzinga does not provide investment advice. All rights reserved.
Trade confidently with insights and alerts from analyst ratings, free reports and breaking news that affects the stocks you care about.

