
Microsoft Corporation (NASDAQ:MSFT) gapped up to start Tuesday’s trading session, where the stock ran into a group of sellers who knocked it down slightly under Friday’s closing price.
The stock has been trading in a fairly consistent uptrend since Jan. 6, making a series of higher highs and higher lows as it edges back toward its Nov. 22, 2021 all-time high of $349.67.
The higher highs indicate the bulls are in control while the intermittent higher lows indicate consolidation periods.
Traders can use moving averages to help identify an uptrend, with rising lower time frame moving averages (such as the eight-day or 21-day exponential moving averages) indicating the stock is in a steep shorter-term uptrend.
Rising longer-term moving averages (such as the 200-day simple moving average) indicate a long-term uptrend.
A stock often signals when the higher high is in by printing a reversal candlestick such as a doji, bearish engulfing or hanging man candlestick. Likewise, the higher low could be signaled when a doji, morning star or hammer candlestick is printed. Moreover, the higher highs and higher lows often take place at resistance and support levels.
In an uptrend, the "trend is your friend" until it’s not, and in an uptrend there are ways for both bullish and bearish traders to participate in the stock.
Want direct analysis? Find me in the BZ Pro lounge! Click here for a free trial.
The Microsoft Chart: Microsoft’s most recent higher low within its uptrend was formed on May 24 at $312.61 and the most recent confirmed higher high was printed at the $322.59 mark two days prior. On Tuesday, Microsoft reached $335.74, which may become the next higher high within the pattern if the stock continues to retrace on Wednesday.
- A retracement, or at least sideways consolidation, is likely because Microsoft’s relative strength index (RSI) has reached 74%. When a stock’s RSI reaches or exceeds the 70% level it becomes overbought, which can be a sell signal for technical traders.
- If Microsoft closes the trading day near or below the $333 level, the stock will print a hanging man or bearish Marubozu candlestick, respectively, which may indicate lower prices are on the horizon. If that happens, the stock may reverse course off the upper trend line of a rising channel that Microsoft has been trading in since March 13.
- Bearish traders want to see Microsoft drop back into the channel and then for big bearish volume to come in and push the stock down toward the lower ascending trend line of the pattern. If that happens, it’s likely to coincide with a drop in the general market, which could increase volatility.
- Traders wishing to trade the volatility in the stock market can use MIAX’s SPIKES Volatility products. The products, which are traded on SPIKES Volatility Index (SPIKE), track expected volatility in the SPDR S&P 500 over the next 30 days.
- Microsoft has resistance above at $338.72 and $349.67 and support below at $323.41 and $316.

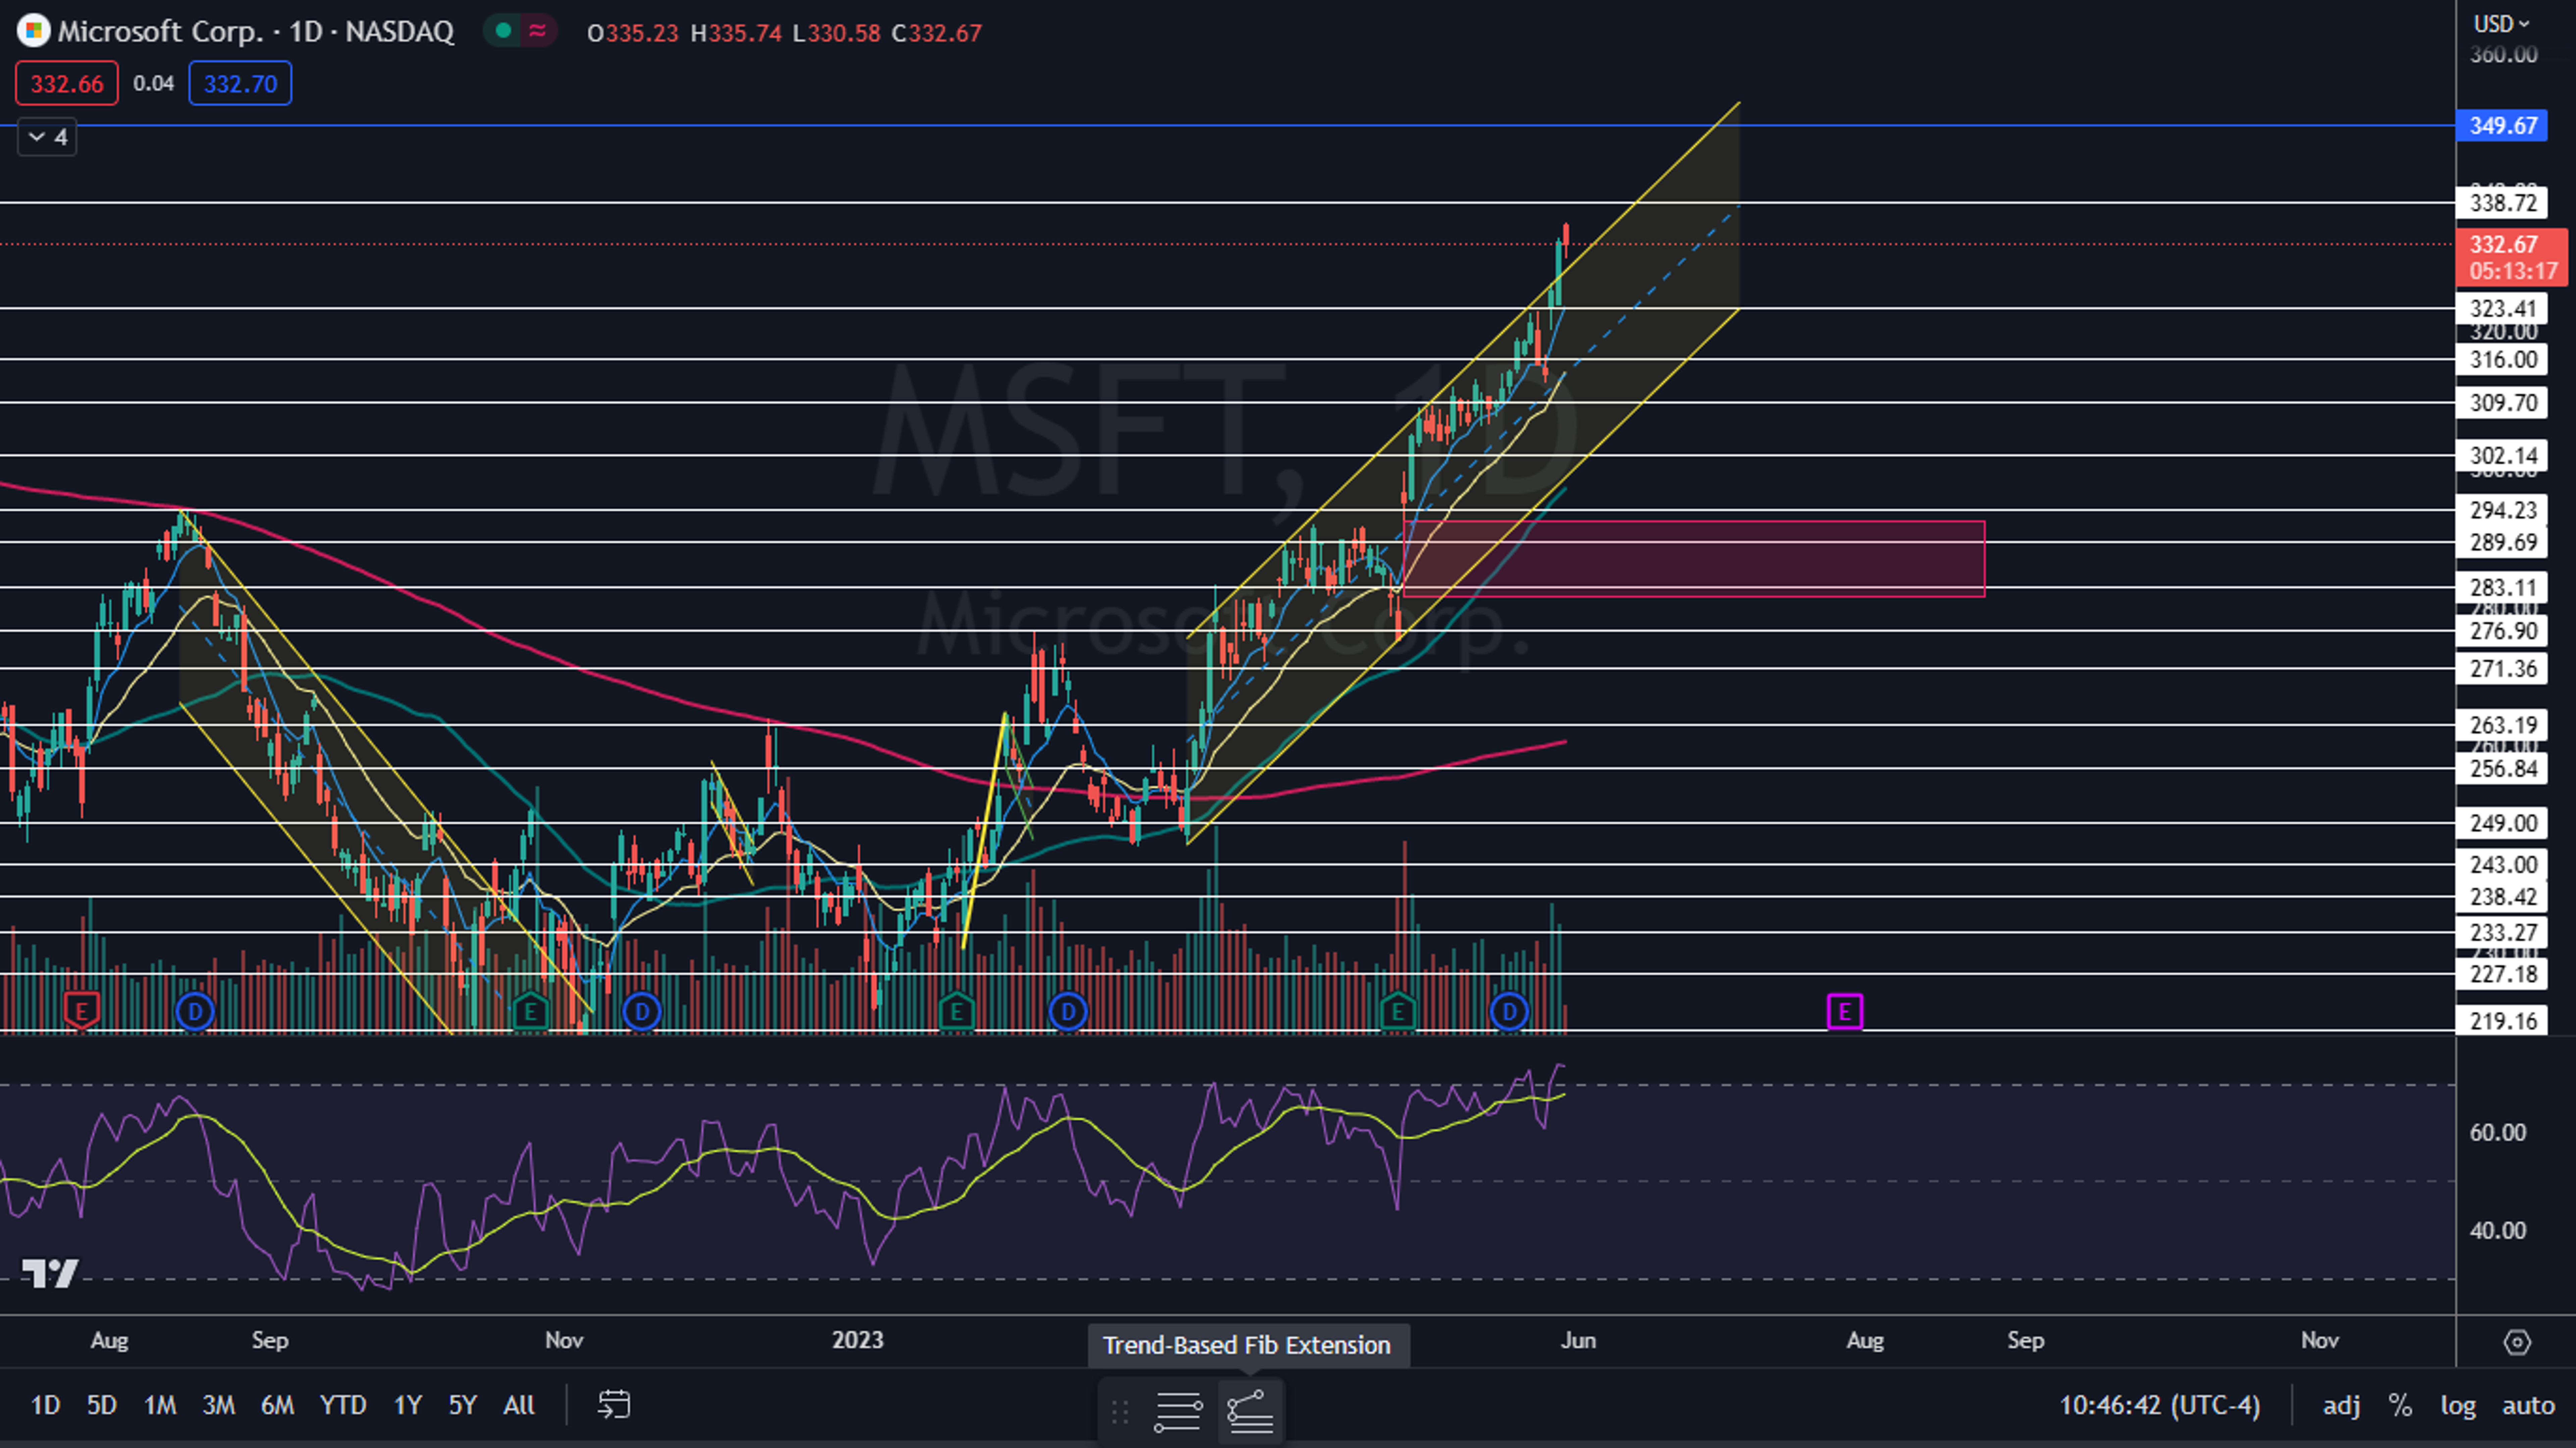
Photo via Shutterstock.
© 2025 Benzinga.com. Benzinga does not provide investment advice. All rights reserved.