
Zinger Key Points
- CANE is an ETF that offers investors a straightforward way to access sugar futures prices within a brokerage account.
- The fund is trading in a downtrend but may be showing signs the local bottom has occurred.
- Historic Summer Setup: 3 "Power Patterns" Triggering in the next 75 Days - Get The Details Now
Teucrium Sugar Fund ETF CANE gapped down to open Monday’s trading session but was looking to have found a potential local bottom from a technical analysis perspective.
Sugar prices have been falling recently and on Friday, the agricultural commodity traded at a 1-week low. Sugar prices have historically been influenced by the current El Nino weather event, which historically brings heavy rains to Brazil and drought to India, affecting sugar crop production, according to The Globe and Mail.
Past instances of El Nino, such as those in 2015 and 2016, have led to significant price fluctuations in the sugar market, highlighting the potential impact of weather patterns on pricing dynamics, said the publication.
In terms of the commodity’s outlook for the short-to-mid-term, there are both bullish and bearish factors that could affect the price of sugar.
Read Next: China Approves Largest Copper Mine In The World In Its Bid To Outpace US
From a bearish perspective, the increase in sugarcane production in India, with the Indian Sugar and Bioenergy Manufacturers Association raising its forecast for the 2023-24 marketing year, could hold down the price of sugar despite the country extending export restrictions after seeing a poor monsoon season, wrote the Globe.
On the bullish side, lower sugarcane production in Thailand, the world's third-largest sugar producer, is down, which could potentially help bolster prices, said the outlet.
From a technical analysis perspective, CANE, which offers investors a straightforward way to access sugar futures prices within a brokerage account, is trading in a confirmed downtrend but looks set to bounce over the short term.
Want direct analysis? Find me in the BZ Pro lounge! Click here for a free trial.
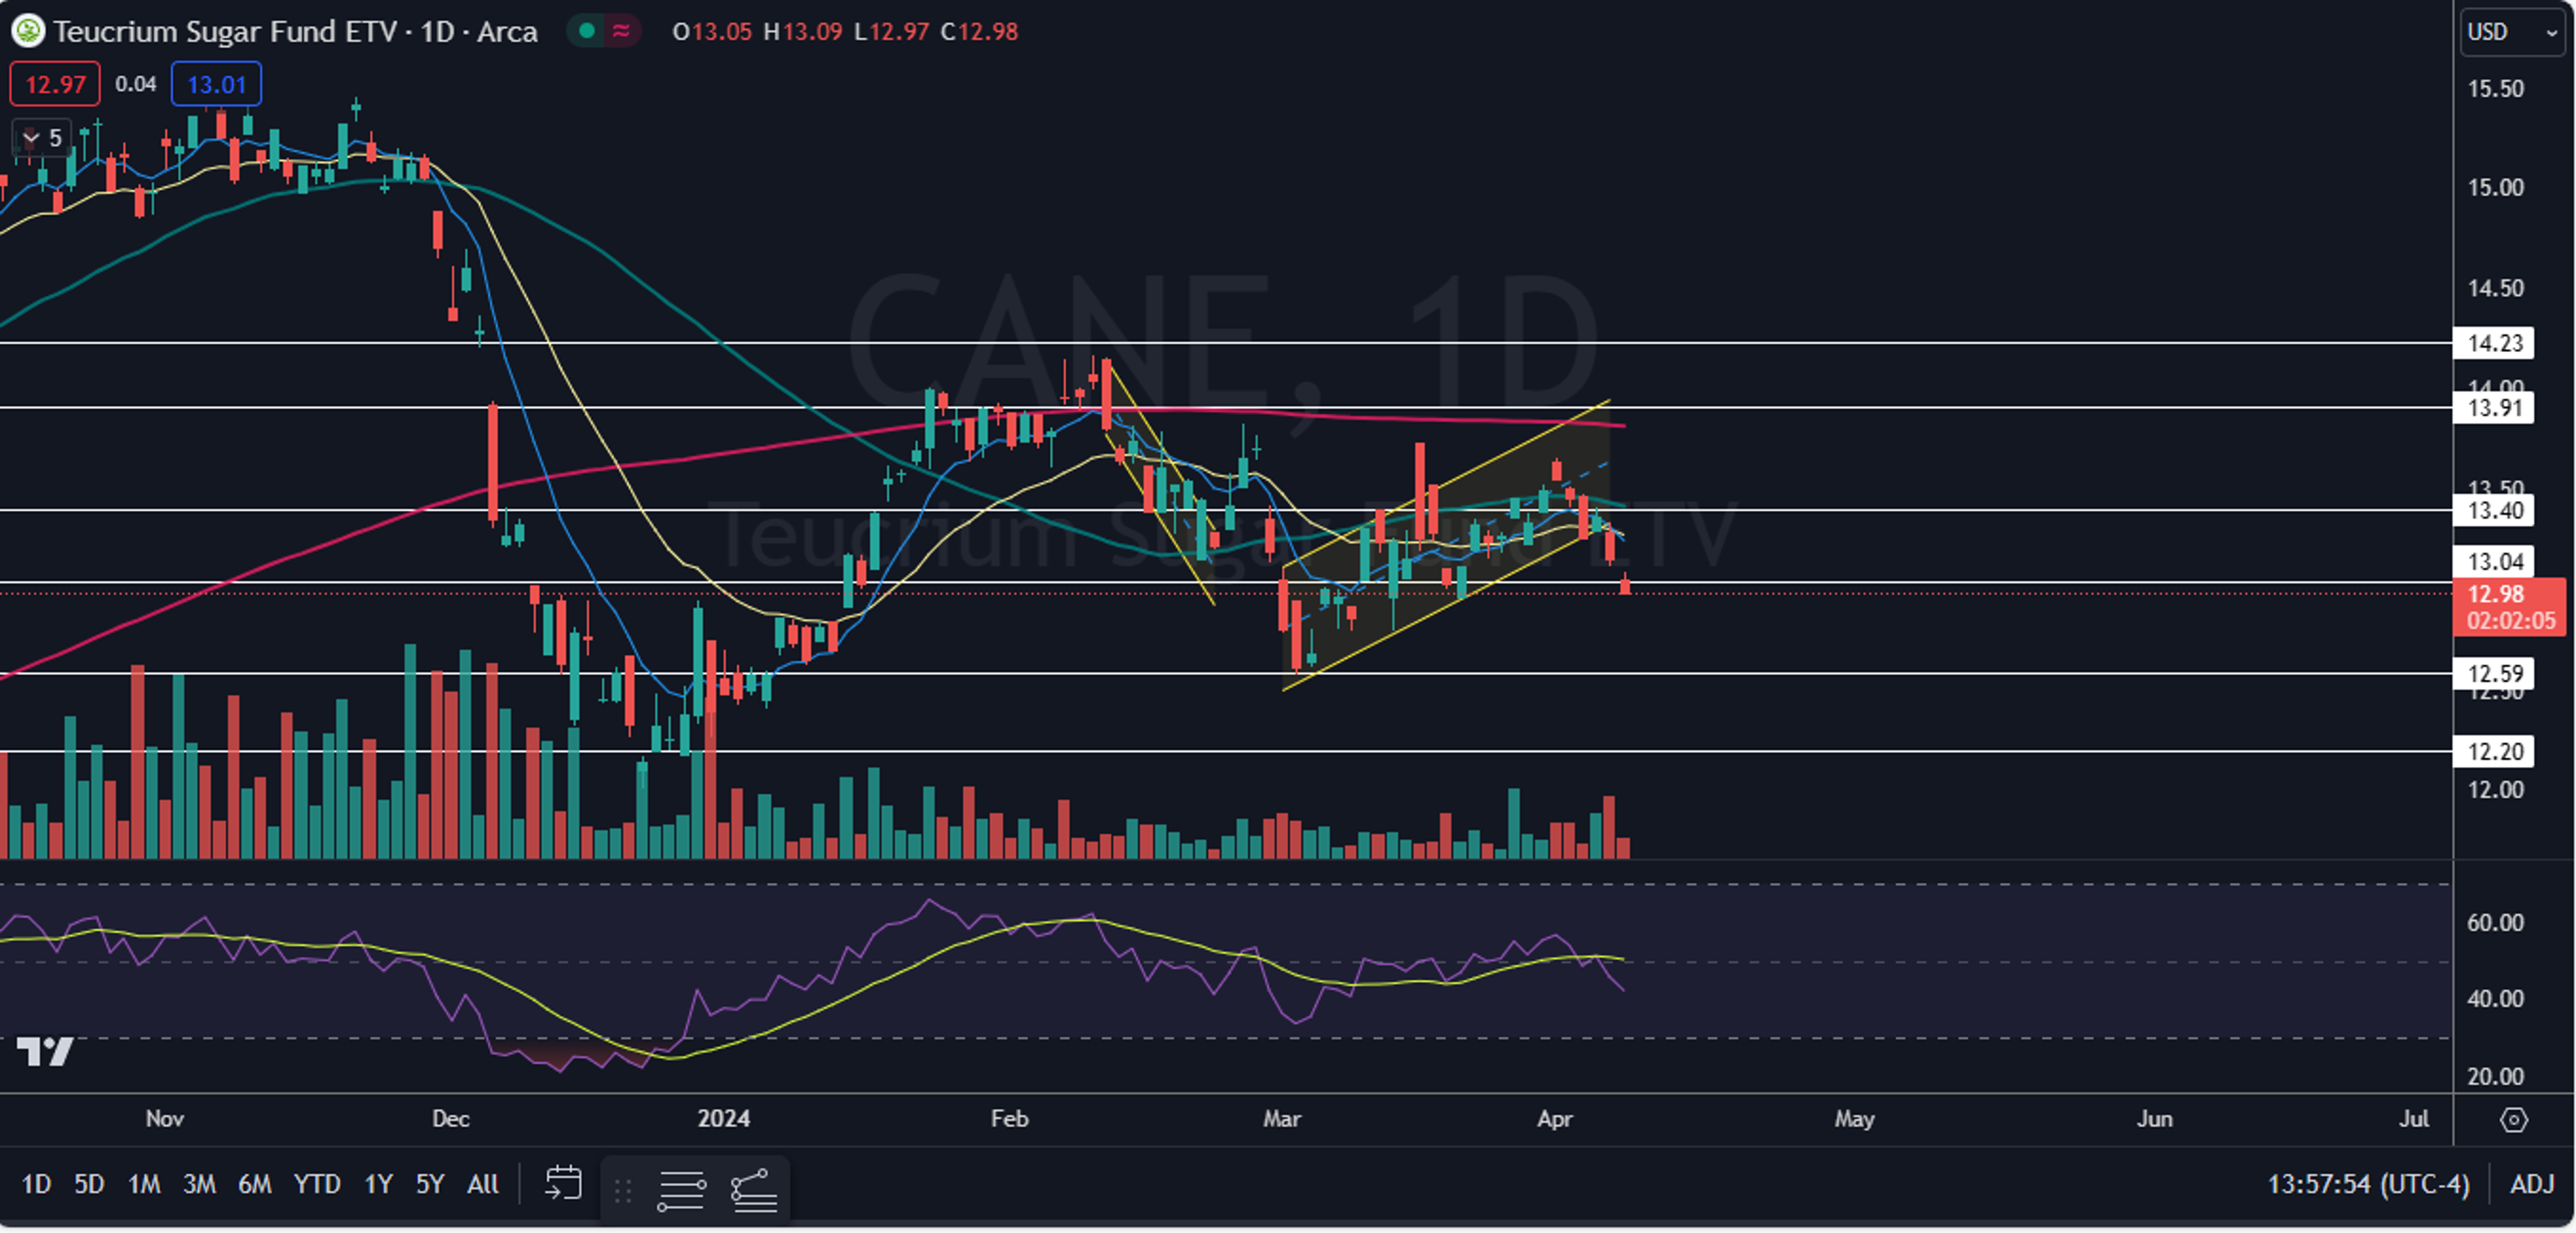
The CANE Chart: On Friday, CANE broke bearishly down from an ascending channel pattern on higher-than-average volume, indicating a longer-term downtrend could be on the horizon. On Monday, CANE gapped down about 1% to start the trading day but was working to print a doji or inverted hammer candlestick, which could indicate the local bottom has occurred and the ETF will rise to at least print another lower high on Tuesday.
- CANE is trading under the 50-day and 200-day simple moving averages (SMAs), with the 50-day SMA trending below the 200-day, which is bearish. On Monday, the eight-day exponential moving average (EMA) crossed under the 21-day EMA, which is also a bearish indicator.
- CANE’s most recent lower high within its downtrend was formed on April 4 at $13.41 and the most recent confirmed lower low was printed at the $13.26 mark the day prior. When CANE eventually rebounds, bearish traders may choose to wait for the ETF to form a bearish reversal candlestick, to indicate the downtrend will continue.
- CANE has resistance above at $13.04 and at $13.40 and support below at $12.59 and at $12.20.

Edge Rankings
Price Trend
© 2025 Benzinga.com. Benzinga does not provide investment advice. All rights reserved.
Trade confidently with insights and alerts from analyst ratings, free reports and breaking news that affects the stocks you care about.

