
AMC Entertainment Holdings, Inc (NYSE:AMC) was plunging over 20% Wednesday after the company filed an agreement to sell up to 40 million shares through an equity distribution agreement with several Wall Street investment banks.
The move lower follows two weeks of downward pressure on the stock after AMC implemented a 10-1 reverse stock split and converted its preferred equity shares (APE units) into common stock.
While Wednesday’s share price drop was drastic, there are both bullish and bearish patterns that have appeared on AMC’s chart. From a technical perspective, while AMC may be settling into a bear flag pattern on the daily chart, the stock could also be forming a bullish double-bottom pattern near the $10.73 mark.
A double bottom pattern is a reversal indicator that shows a stock has dropped to a key support level, rebounded, back-tested the level as support and is likely to rebound again. It is possible the stock may retest the level as support again creating a triple bottom or even quadruple bottom pattern.
The bear flag pattern is created with a steep drop lower forming the pole, which is then followed by a consolidation pattern that brings the stock higher between a channel with parallel lines or into a tightening triangle pattern.
Want direct analysis? Find me in the BZ Pro lounge! Click here for a free trial.
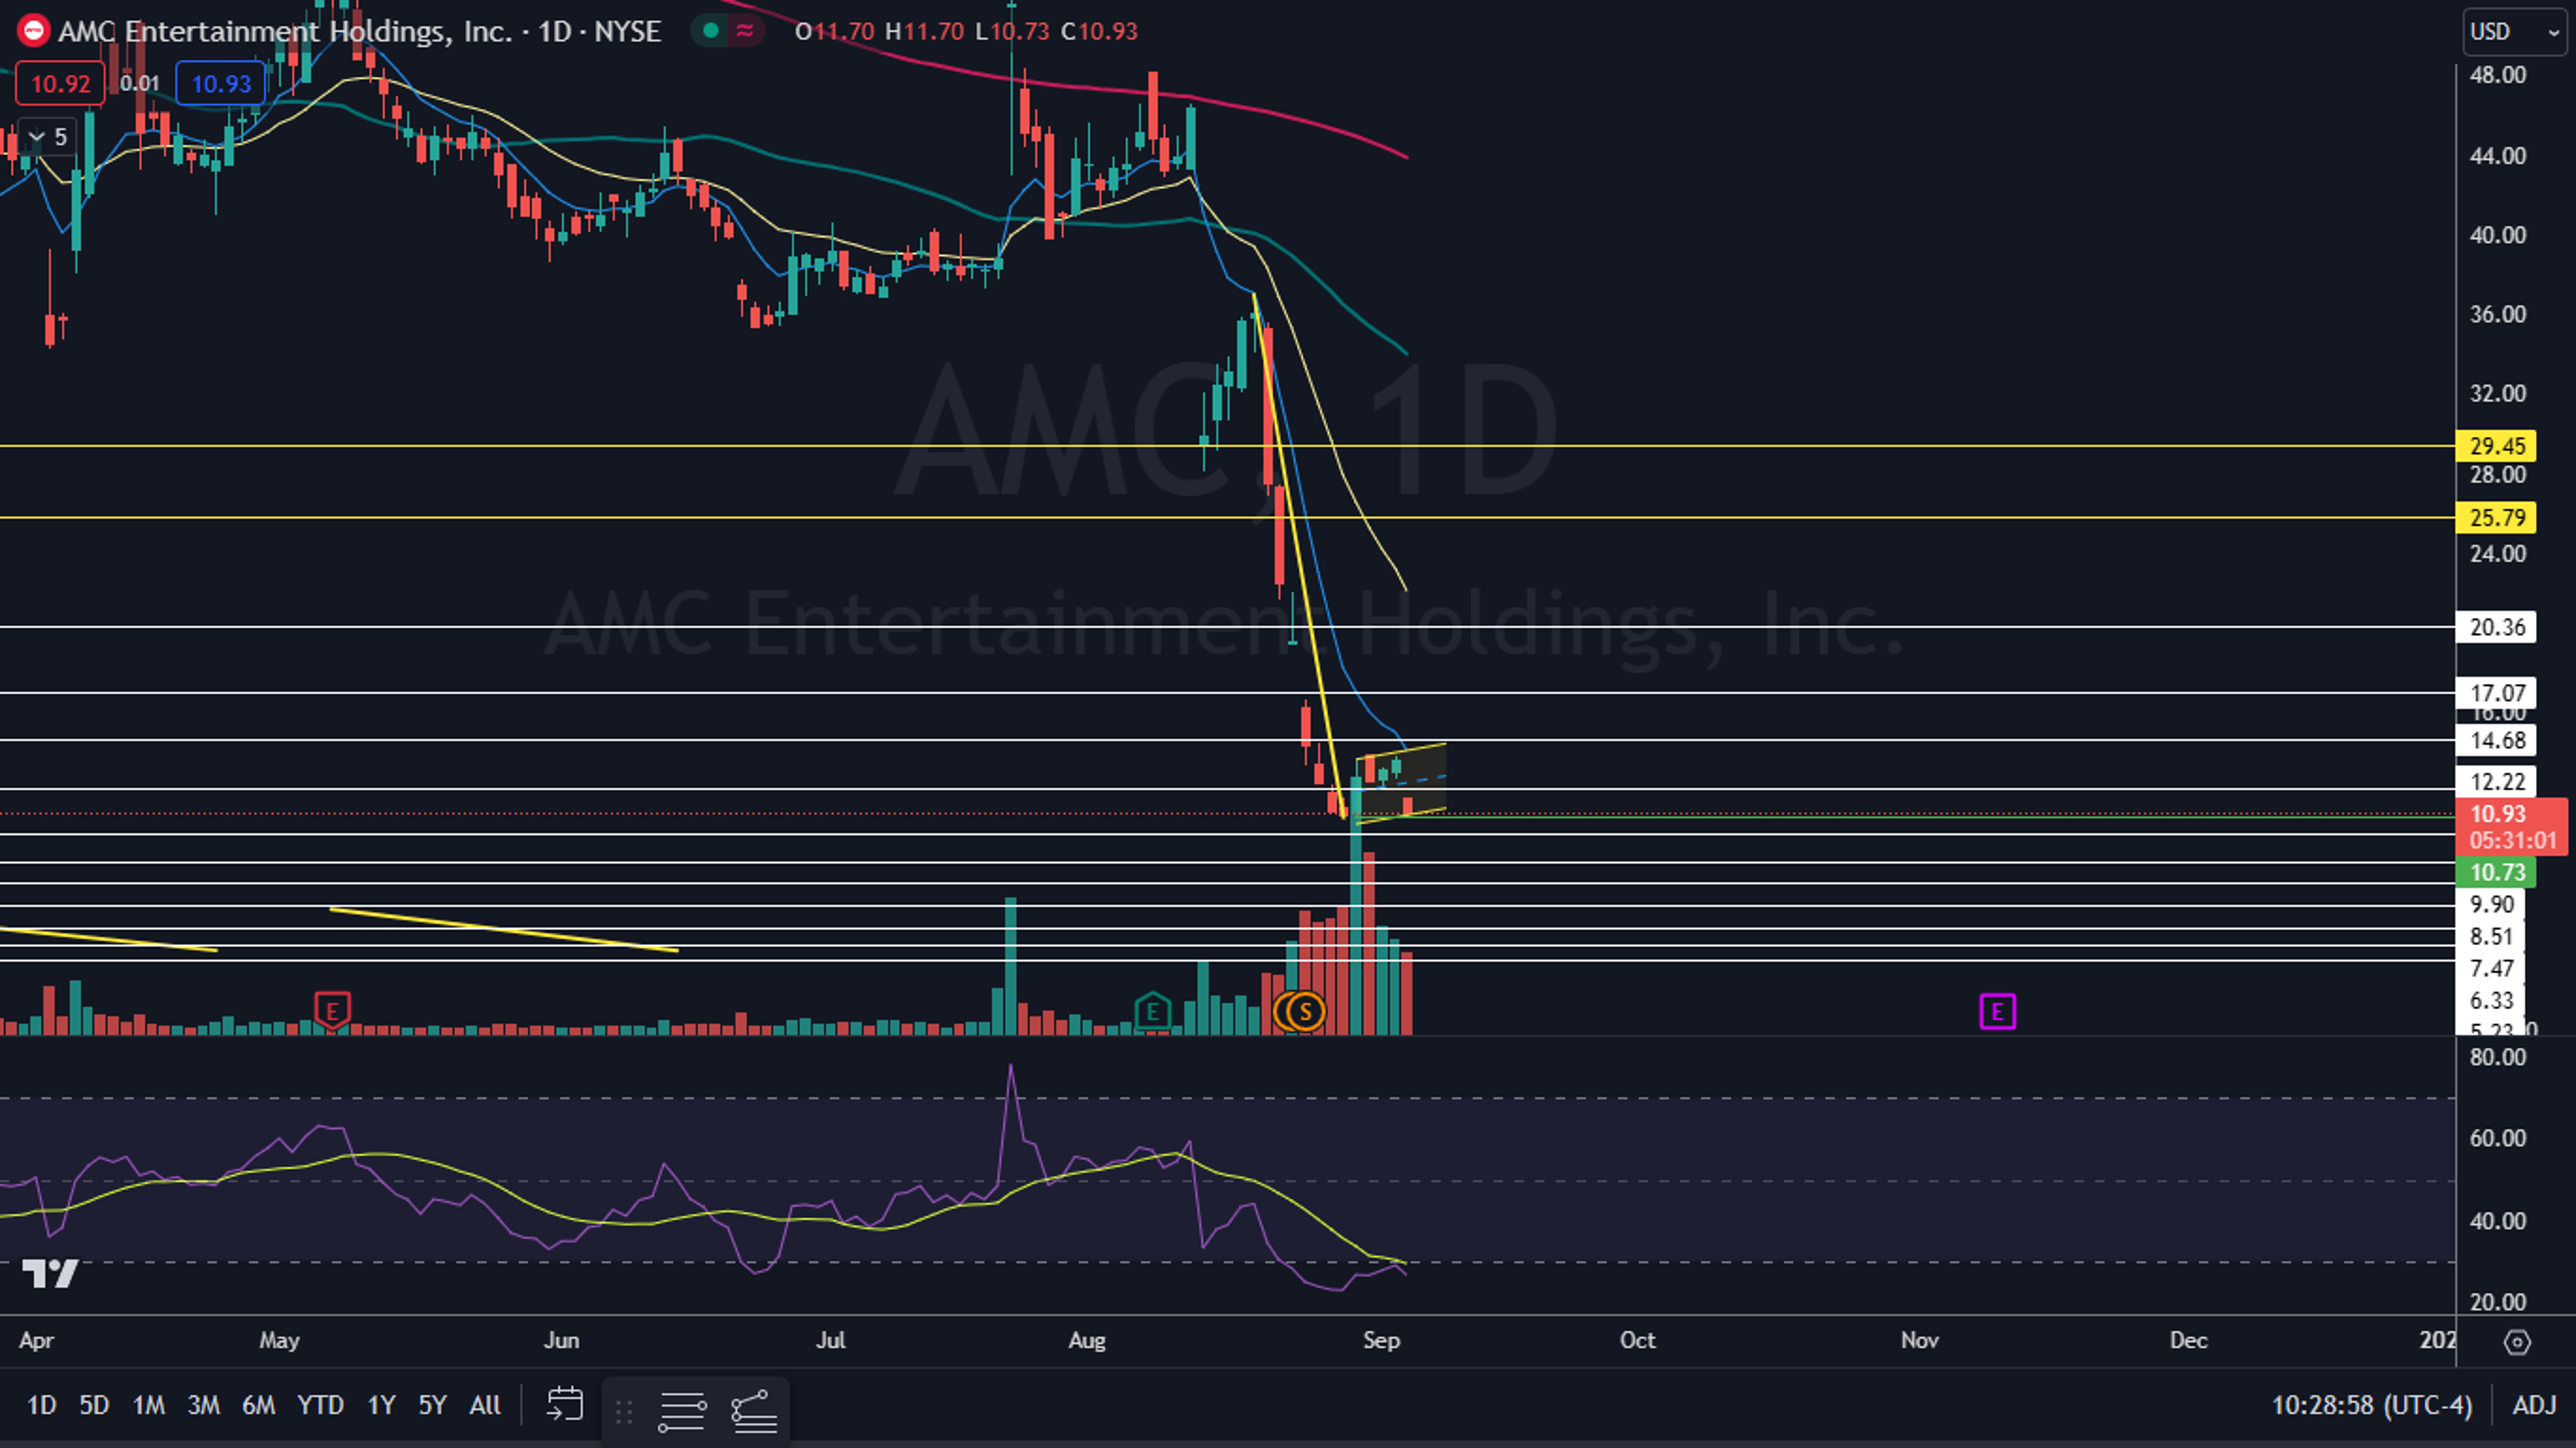
The AMC Chart: AMC’s possible bear flag pattern was formed between Aug. 18 and Wednesday, with the downward sloping pole formed over the first eight trading days of that timeframe and the flag formed over the trading days that followed. If the bear flag is recognized, the measured move is about 70%, which suggests AMC could plummet toward $4.
- If the double bottom pattern holds, however, and AMC bounces up later on Wednesday to close the trading day with a lower wick, the stock could be in for a reversal to the upside. If AMC regains the eight-day exponential moving average, which is trending at about $14, the flag will be negated.
- The move lower on Wednesday was taking place on lower-than-average volume, which indicates fear selling isn’t taking place. If the stock breaks down from the bear flag, selling could accelerate and the stock will confirm a new downtrend.
- AMC has resistance above at $12.22 and at $14.68 and support below at $10.73 and at $9.90.

© 2025 Benzinga.com. Benzinga does not provide investment advice. All rights reserved.