
Zinger Key Points
- The VIX was looking to print a reversal candlestick on Tuesday, indicating volatility may increase in the stock market.
- The VIX measures the amount of fear and stress in the S&P 500.
- Discover the top trade setups and strategies beating the S&P this year —live this Wednesday at 6 PM ET. Reserve your free spot now.
The Cboe Volatility Index VIX was dropping about 1.4% lower on Tuesday, its lowest level since Jan. 5, 2022, which is when the S&P 500 was trading near all-time highs.
Jan. 4, 2022, marked the all-time high for the S&P 500, when the ETF reached 4,818.62.
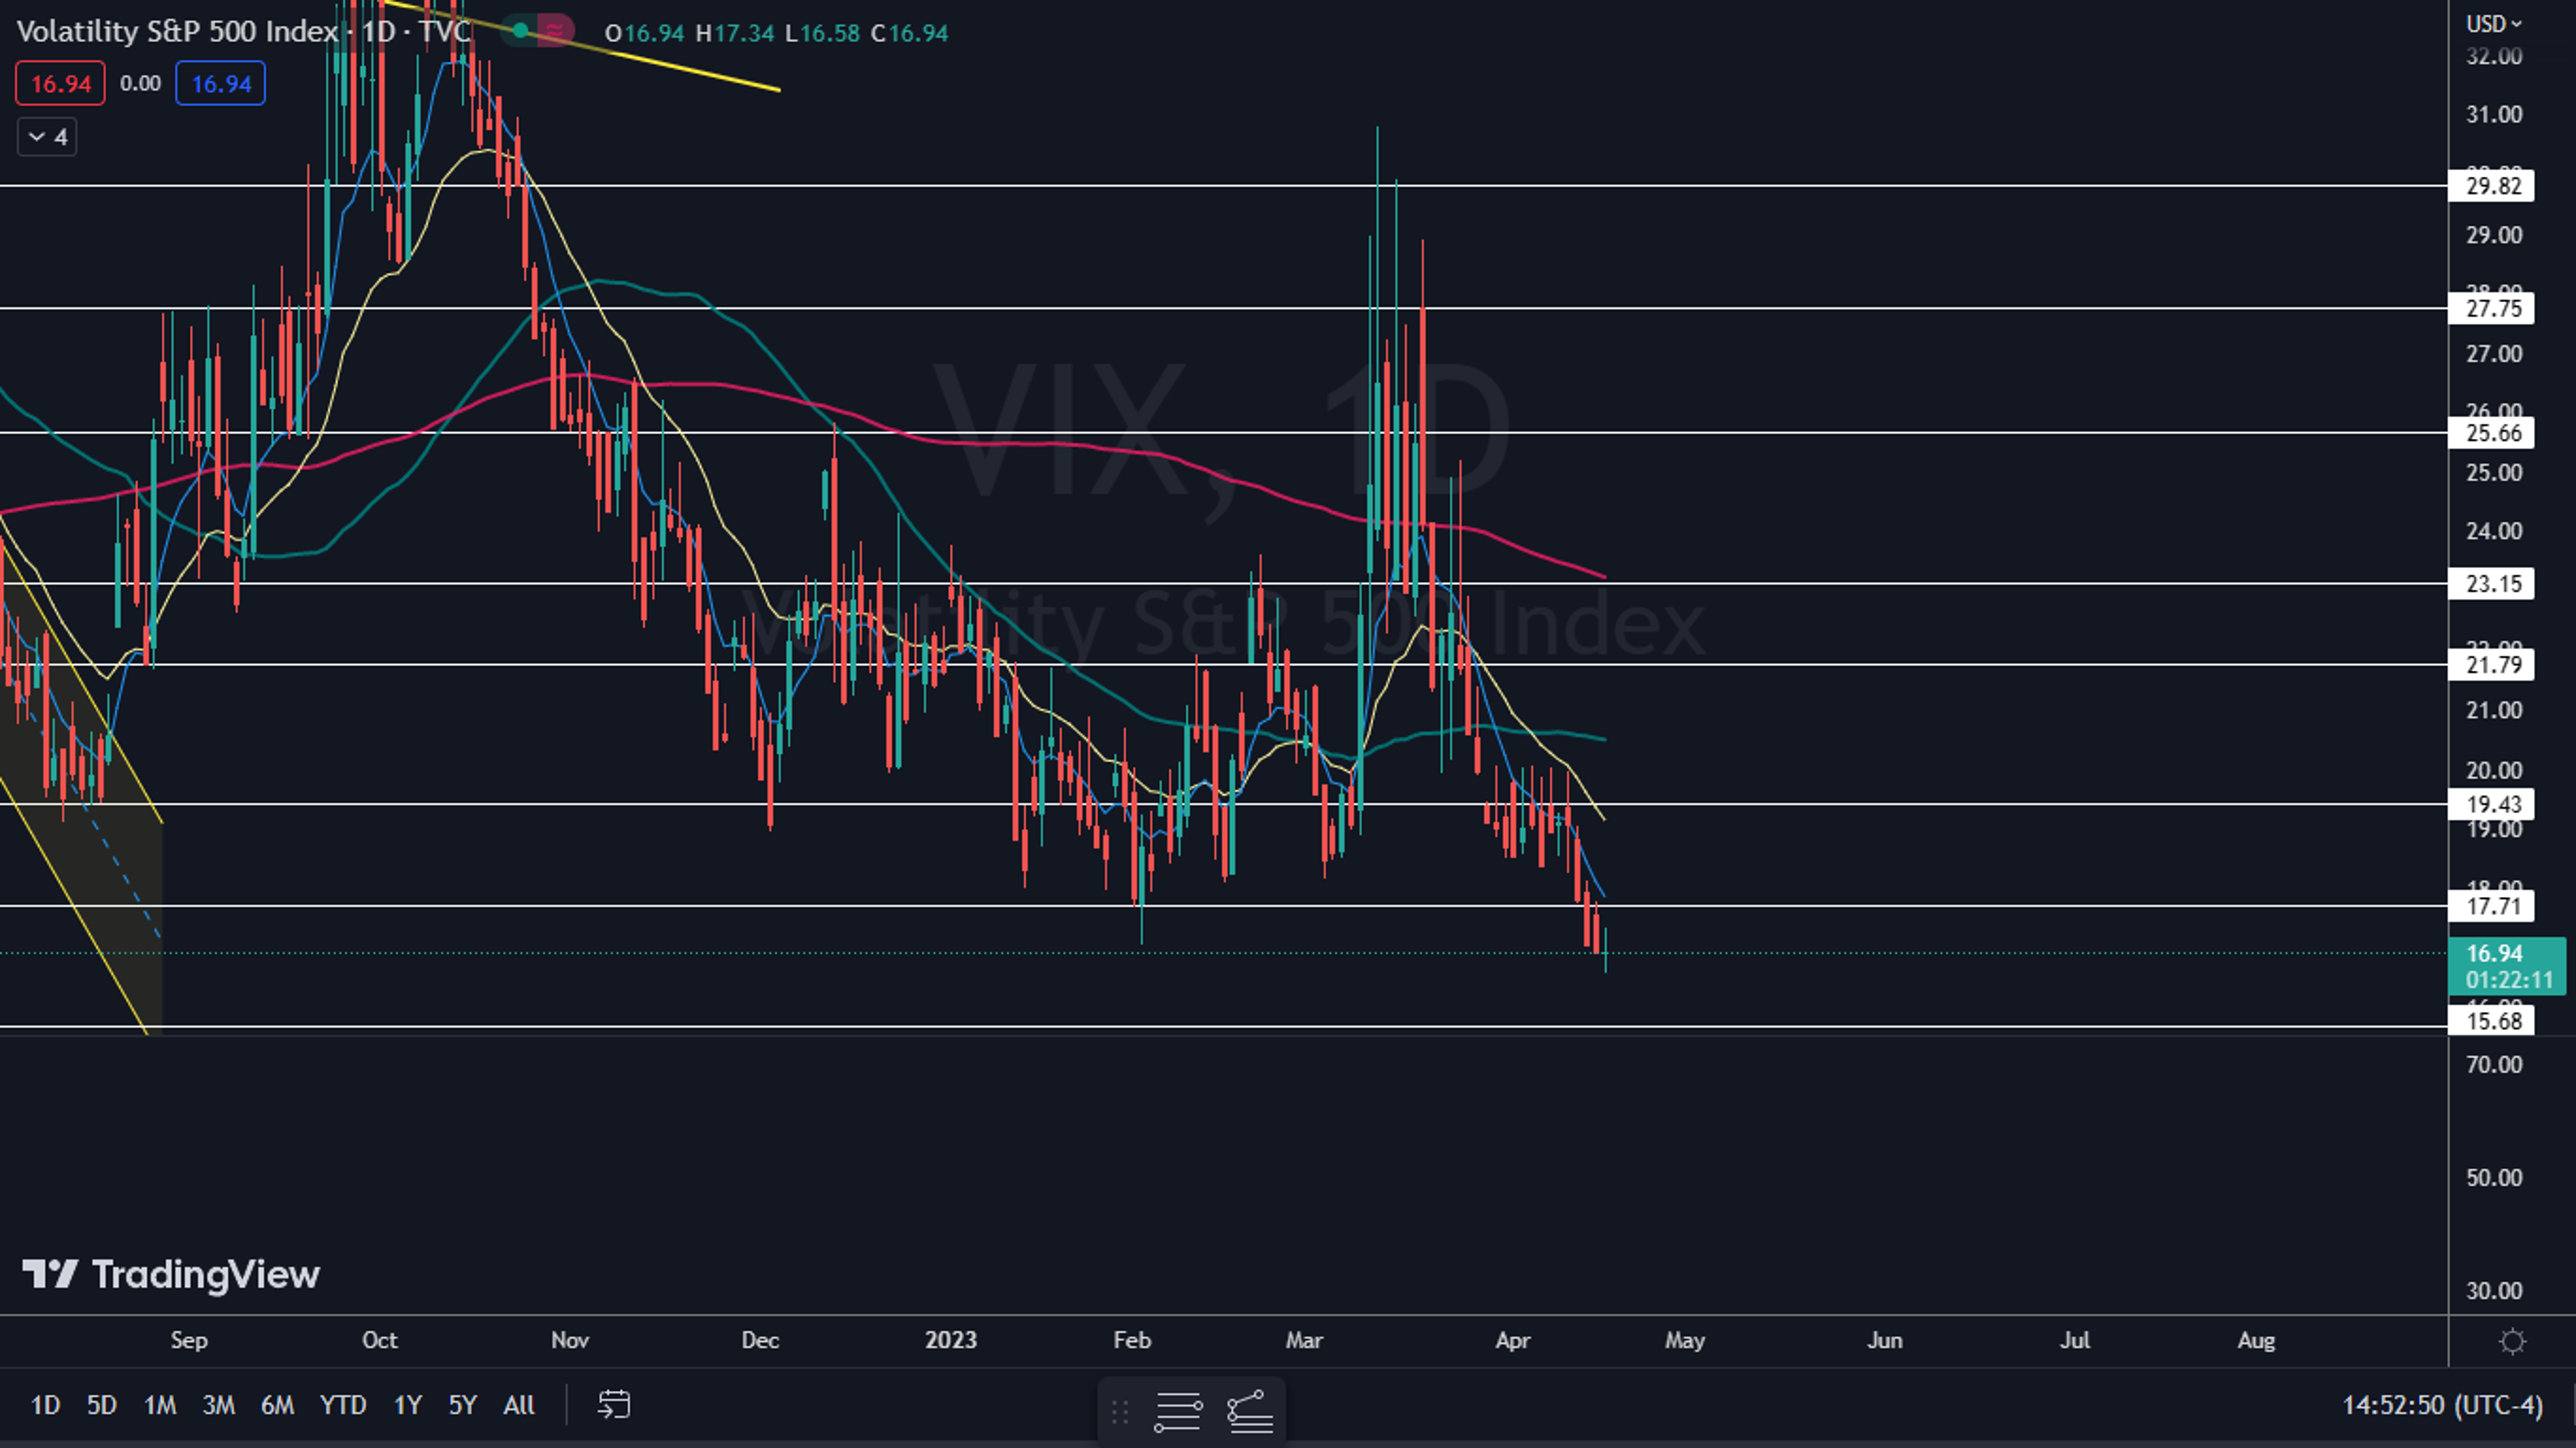
The VIX’s most recent decline began on March 13, when the index topped out at 30.81. The VIX has now printed five red daily candlesticks in a row since April 12, sliding almost 14% without an intermittent bounce.
The VIX is an index that represents the implied volatility of the S&P 500 over the next 30 days. It can be used to measure the level of fear or stress being experienced by market participants. The price action of the S&P 500 and the VIX often move inversely to each other, meaning that when the S&P 500 rises, the VIX usually falls, and vice versa.
With this in mind, the VIX is indicating that the S&P 500 may continue to advance modestly over the next month.
Traders wishing to trade the volatility in the stock market can use Miax’s SPIKES Volatility products. The products, which are traded on SPIKES Volatility Index (SPIKE) track expected volatility in the SPDR S&P 500 ETF SPY over the next 30 days.
Want direct analysis? Find me in the BZ Pro lounge! Click here for a free trial.
The VIX Chart: Although the VIX has been declining most recently, the index was working to print an inverted hammer or doji candlestick on Tuesday, which may indicate a bounce is on the horizon. If that happens, the S&P 500 could retrace lower.
- When the VIX eventually bounces, the index may find resistance at the eight-day exponential moving average (EMA), which has been guiding the VIX lower since March 22. If the index regains that level, a longer-term rebound could be on the horizon.
- The VIX has resistance above at 17.71 and 19.43 and support below at 15.68 and 14.10.

Edge Rankings
Price Trend
© 2025 Benzinga.com. Benzinga does not provide investment advice. All rights reserved.
Trade confidently with insights and alerts from analyst ratings, free reports and breaking news that affects the stocks you care about.

