


Zinger Key Points
- Bitcoin negates its downtrends by printing a higher high, while Ethereum confirms a new uptrend.
- Dogecoin may be settling into a triangle pattern on the daily chart.
- Get Matt Maley’s top trade setups for a tariff-driven market, live this Wednesday at 6 PM ET. Reserve your free spot now.
Bitcoin BTC/USD was edging slightly higher during Friday’s 24-hour trading session, in tandem with the S&P 500 which was rallying about 0.8% in response to core PCE inflation data, which came in below analyst estimates.
The number came in at 4.6%, slightly under the 4.7% rise analysts expected, which indicated the Fed’s hawkish policy is starting to lower stubborn inflation.
Ethereum ETH/USD and Dogecoin DOGE/USD were also rebounding on Friday after sinking lower during Thursday’s session. All three cryptos have been consolidating mostly sideways for a long period of time under strong resistance levels.
Traders and investors will be watching the crypto sector over the weekend for clues as to how the stock market may behave next week.
Want direct analysis? Find me in the BZ Pro lounge! Click here for a free trial.
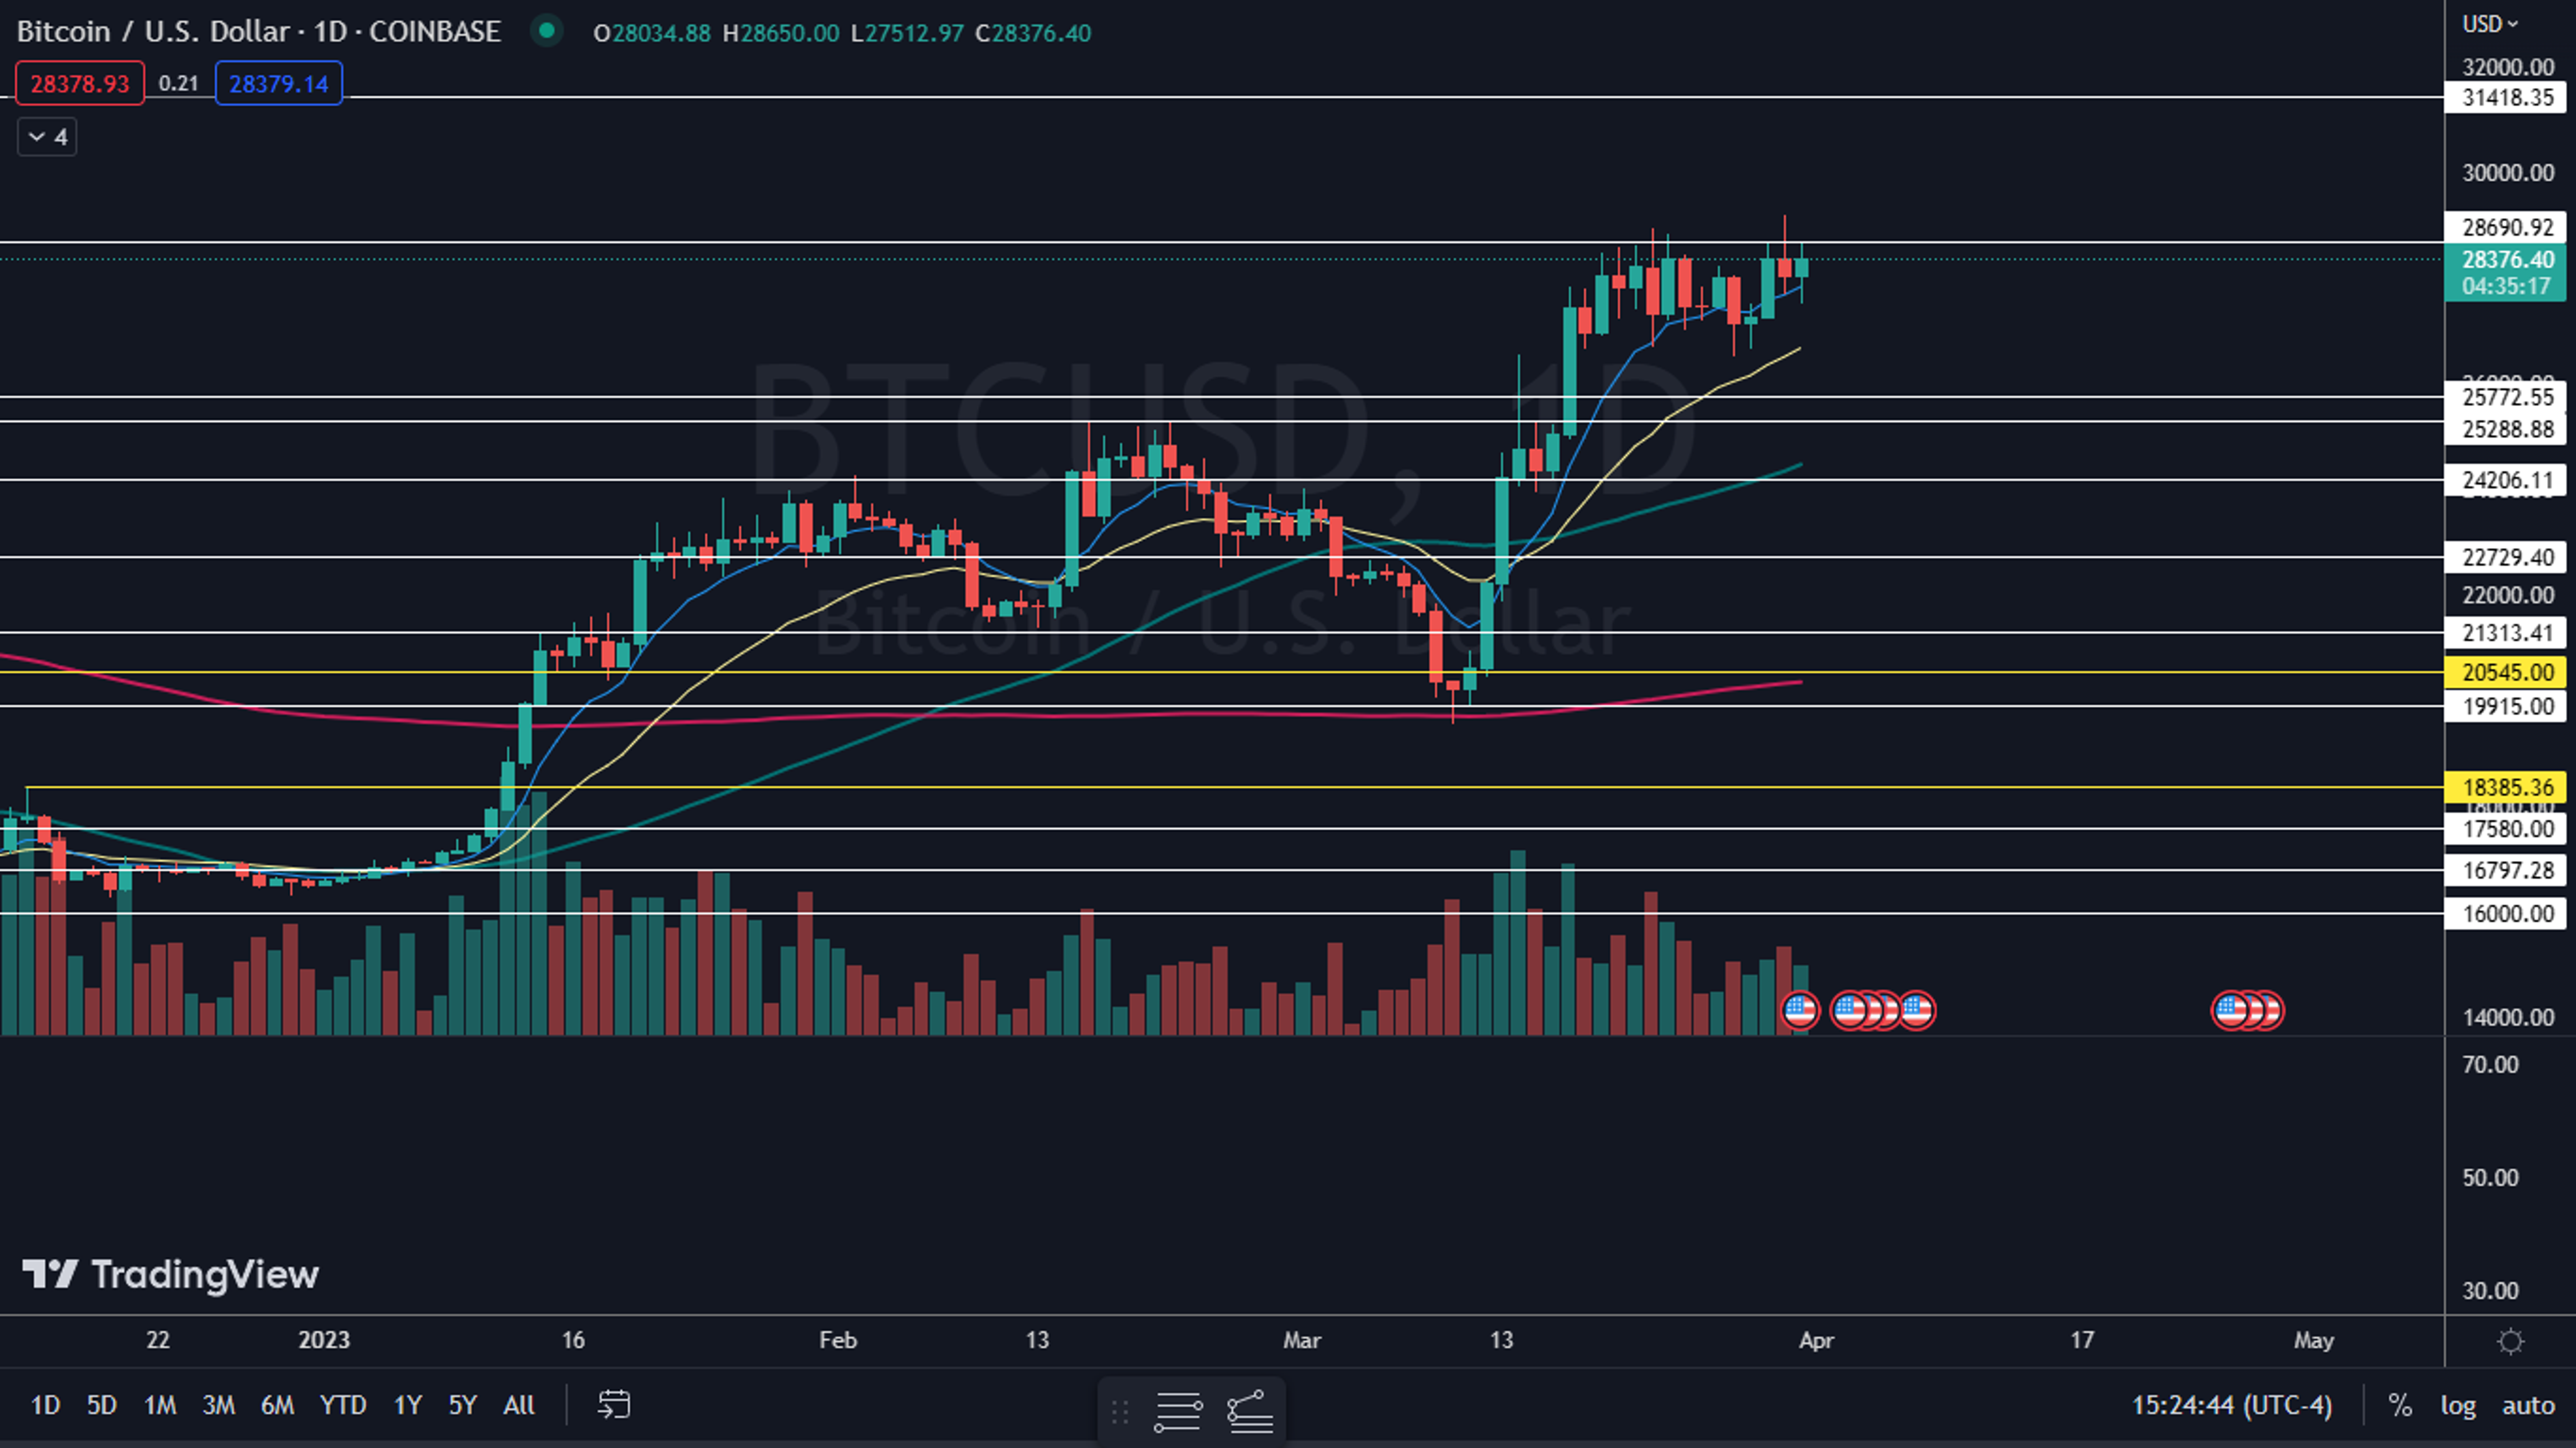
The Bitcoin Chart: Bitcoin has been consolidating under a resistance level at $28,700 since March 19, unable to close a 24-hour trading session above the area. On Friday, Bitcoin attempted to bust up through the resistance but ran into a group of sellers who dropped the crypto down from the area.
- Bitcoin has been holding support above the eight-day exponential moving average (EMA) since March 13 and on Friday tested the area as support before bouncing higher. The eight-day EMA is curling upwards and may continue to guide the crypto higher, through the $28,700 mark over the weekend.
- The crypto negated its downtrend on Thursday by printing a higher high of $29,190. If Bitcoin is able to break up through that area over the weekend, Friday’s low-of-day will serve as the higher low to confirm a new uptrend.
- If Bitcoin falls under the eight-day EMA, it may find support at the 21-day EMA.
- Bitcoin has resistance above at $28,690 and $31,418 and support below at $25,772 and $25,288.

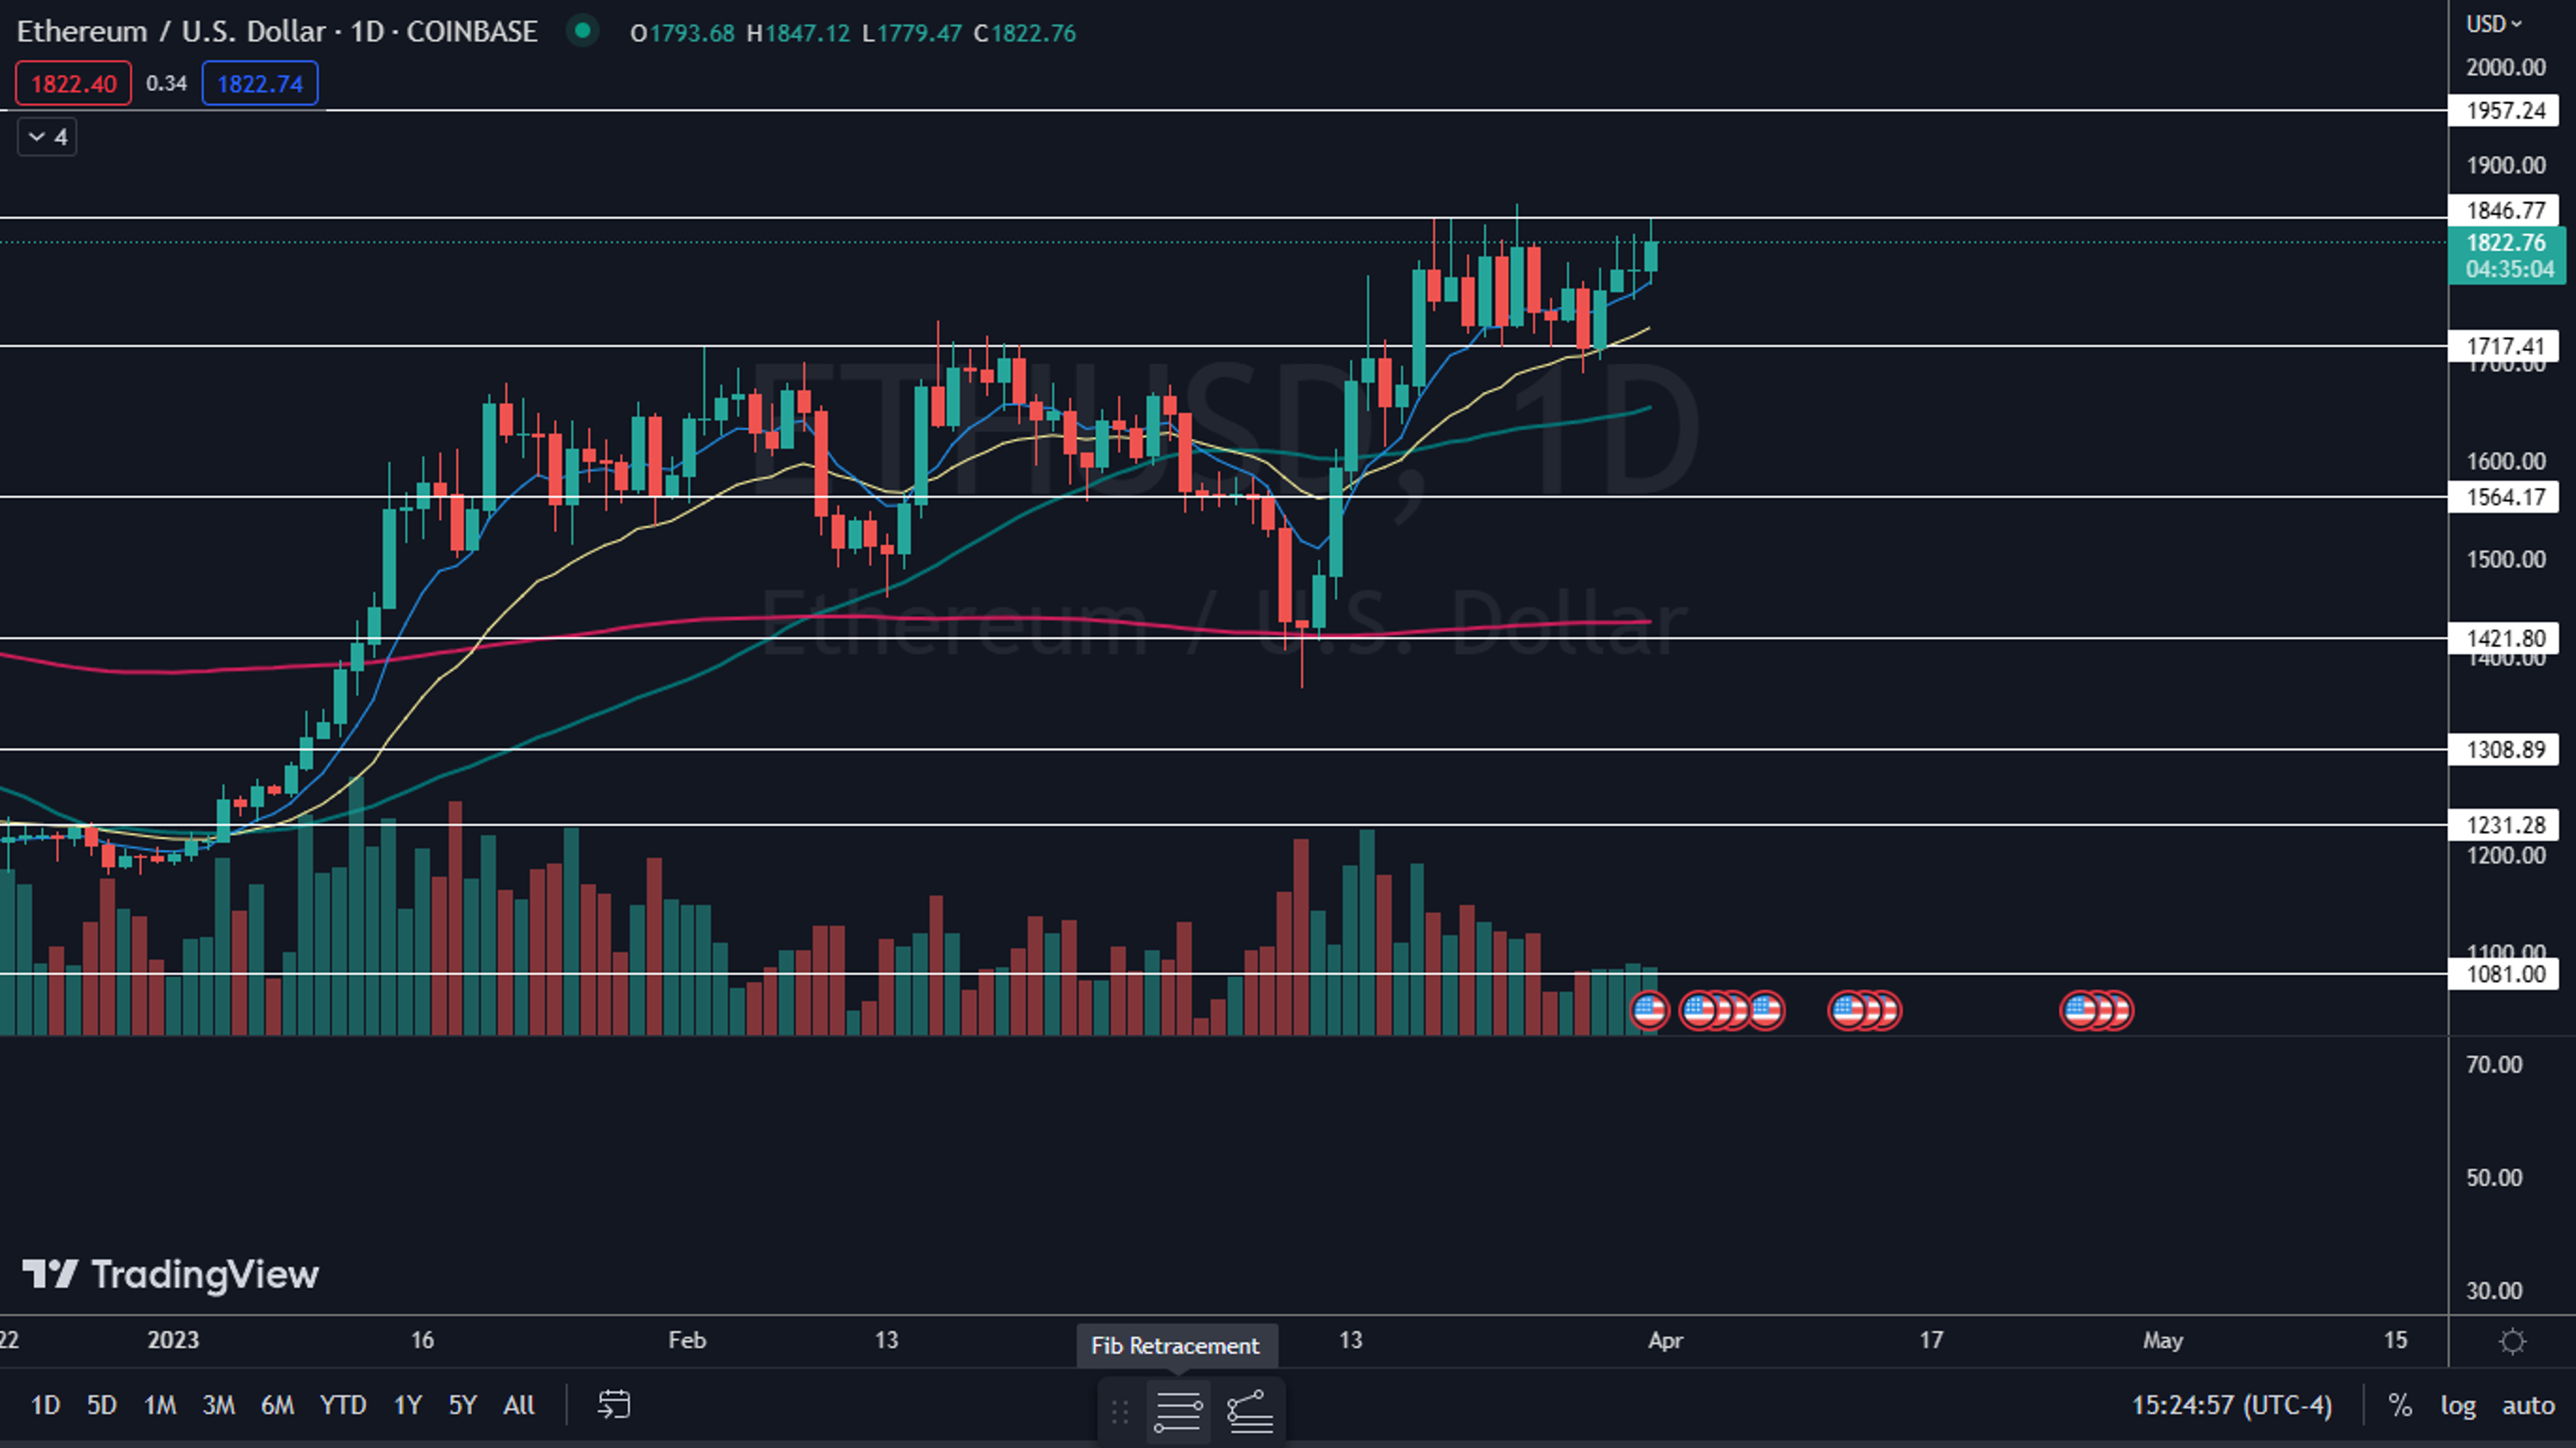
The Ethereum Chart: Ethereum confirmed a new uptrend during Friday’s 24-hour trading session by printing a higher high, which was above the most recent high of $1,827, printed on Wednesday. Like Bitcoin, Ethereum was unable to break above a strong resistance level at $1,846.
- Bullish traders want to see the crypto break up through that level over the weekend, which would confirm Thursday’s low-of-day is a higher low within Ethereum’s uptrend. Bearish traders want to see big bearish volume come in and knock Ethereum down under the eight-day EMA, which will negate the current uptrend.
- Ethereum has resistance above at $1,846 and $1,947 and support below at $1,717 and $1,546.
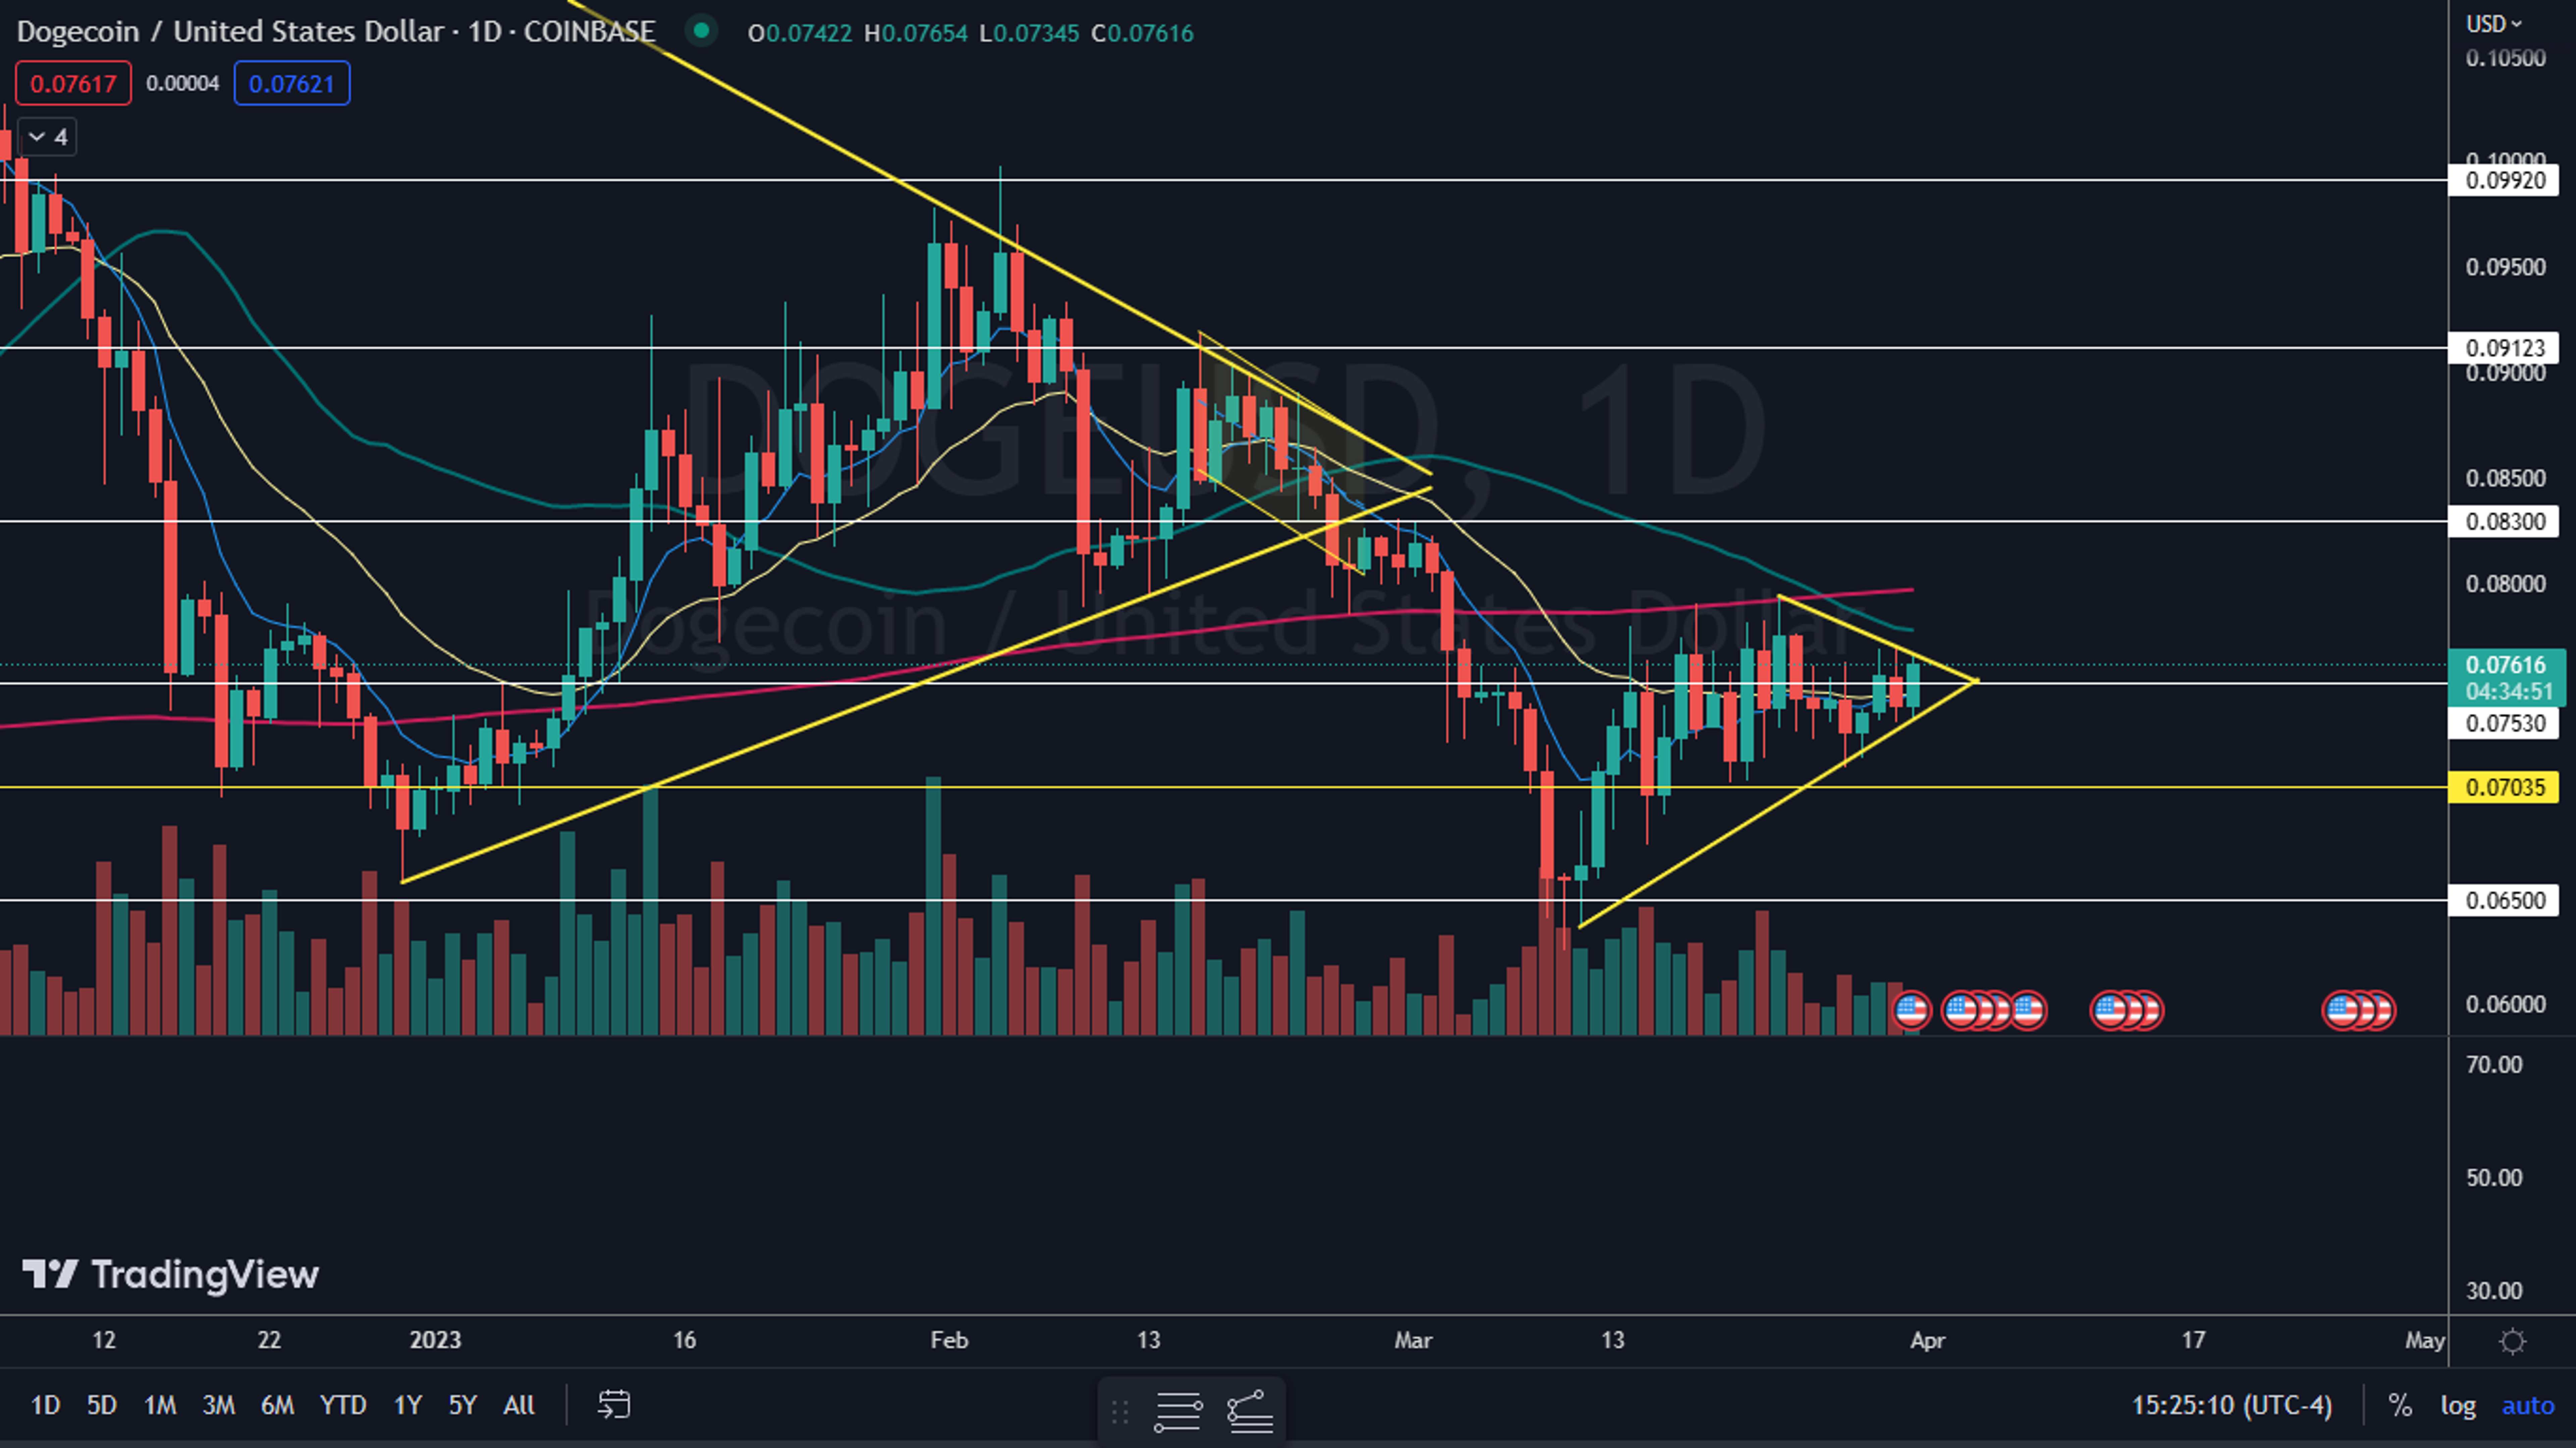
The Dogecoin Chart: Like Bitcoin and Ethereum, Dogecoin is also trading in a mostly sideways trading pattern but recently Dogecoin has also settled into a triangle pattern on the daily chart. Within the pattern, Dogecoin has been making a series of lower highs and higher lows, indicating consolidation.
- Dogecoin is set to meet the apex of the triangle on April 4 and traders and investors can watch for the crypto to break up or down from the pattern on higher-than-average volume to gauge future direction.
- Dogecoin has resistance above at $0.083 and $0.091 and support below at $0.075 and at the 7-cent mark.
Read Next: Widespread Liquidity Woes Threaten Bitcoin, Ethereum's Future — Experts Sound The Alarm
Photo: Unsplash
Edge Rankings
Price Trend
© 2025 Benzinga.com. Benzinga does not provide investment advice. All rights reserved.
Trade confidently with insights and alerts from analyst ratings, free reports and breaking news that affects the stocks you care about.

