


Zinger Key Points
- The S&P 500 is within 0.2% of confirming the bear market has come to an end.
- The market is heading into the biggest after-hours session of the fourth-quarter earnings season.
- Today's manic market swings are creating the perfect setup for Matt’s next volatility trade. Get his next trade alert for free, right here.
The S&P 500 index, which is tracked by the SPDR S&P 500 ETF Trust SPY, was spiking up about 1.3% on Thursday, boosted by a positive reaction to Meta Platform’s fourth-quarter financial report and heading into the biggest after market session of the earnings season.
The move higher on the stock market index brought the S&P 500 up 19.81% off the Oct. 13 bear market low of 3,491.58. When the S&P 500 regains 20% from a bear market low, the end of the bear market can officially be called.
That could happen later on Thursday or on Friday, if the largest big-tech names reporting earnings after the market closes receive positive reactions.
If that occurs, the 50-day simple moving average (SMA) will cross above the 200-day SMA, which will cause a golden cross to form on the market ETF’s chart, possibly predicting a new and strong bull cycle is in the cards.
More conservative bullish traders may want to wait for the S&P 500 to eventually back test a key level, such as the psychologically important 4,100 mark, and then bounce up from the area for confirmation the bear market is over.
Indications the bear market could be coming to an end occurred on Jan. 23, when the S&P 500 burst up through the 200-day SMA and through a long-term descending trendline that had been holding the ETF down since Jan. 4, 2022.


On Jan. 30 and Jan. 31, the S&P 500 retraced to test support at the eight-day exponential moving average and held above the area, which indicated another rebound was likely in the cards, putting the ETF in a position to to continue higher on Wednesday and Thursday.
After the market close, Amazon, Apple and Alphabet are some of the biggest names that will report earnings, along with Ford, Qualcomm, Starbucks, Gilead and MicroStrategy. Traders and investors will be paying close attention to how those individual stocks move following their reports.
Want direct analysis? Find me in the BZ Pro lounge! Click here for a free trial.
The S&P 500 Chart: In order for the bear market to be called over, the S&P 500 needs to reach 4,192 and not reject the level as resistance. It’s possible the S&P 500 could temporarily pop above the level and then fall back under the area. That move would need to be reevaluated to determine if the move lower is a small retracement or if a bull trap was created and the bear market will resume.
- For now, the S&P 500 looks set to continue higher in its uptrend, although a higher low above 4,017.76 will eventually need to print. The market ETF’s most recent confirmed higher high was formed on Jan. 27 at 4,094.21.
- If the market reacts positively to the earnings after hours and opens higher on Friday, the S&P 500’s relative strength index (RSI) will enter into overbought territory, which could indicate a pullback will come sooner rather than later.
- The S&P 500’s RSI is measuring in at 69%, and if it reaches above 70%, some selling is likely to take place based on overbought conditions alone.
- The S&P 500 has resistance above at 4,183.31 and 4,325.28 and support below at 4,100.41 and 3,976.83.

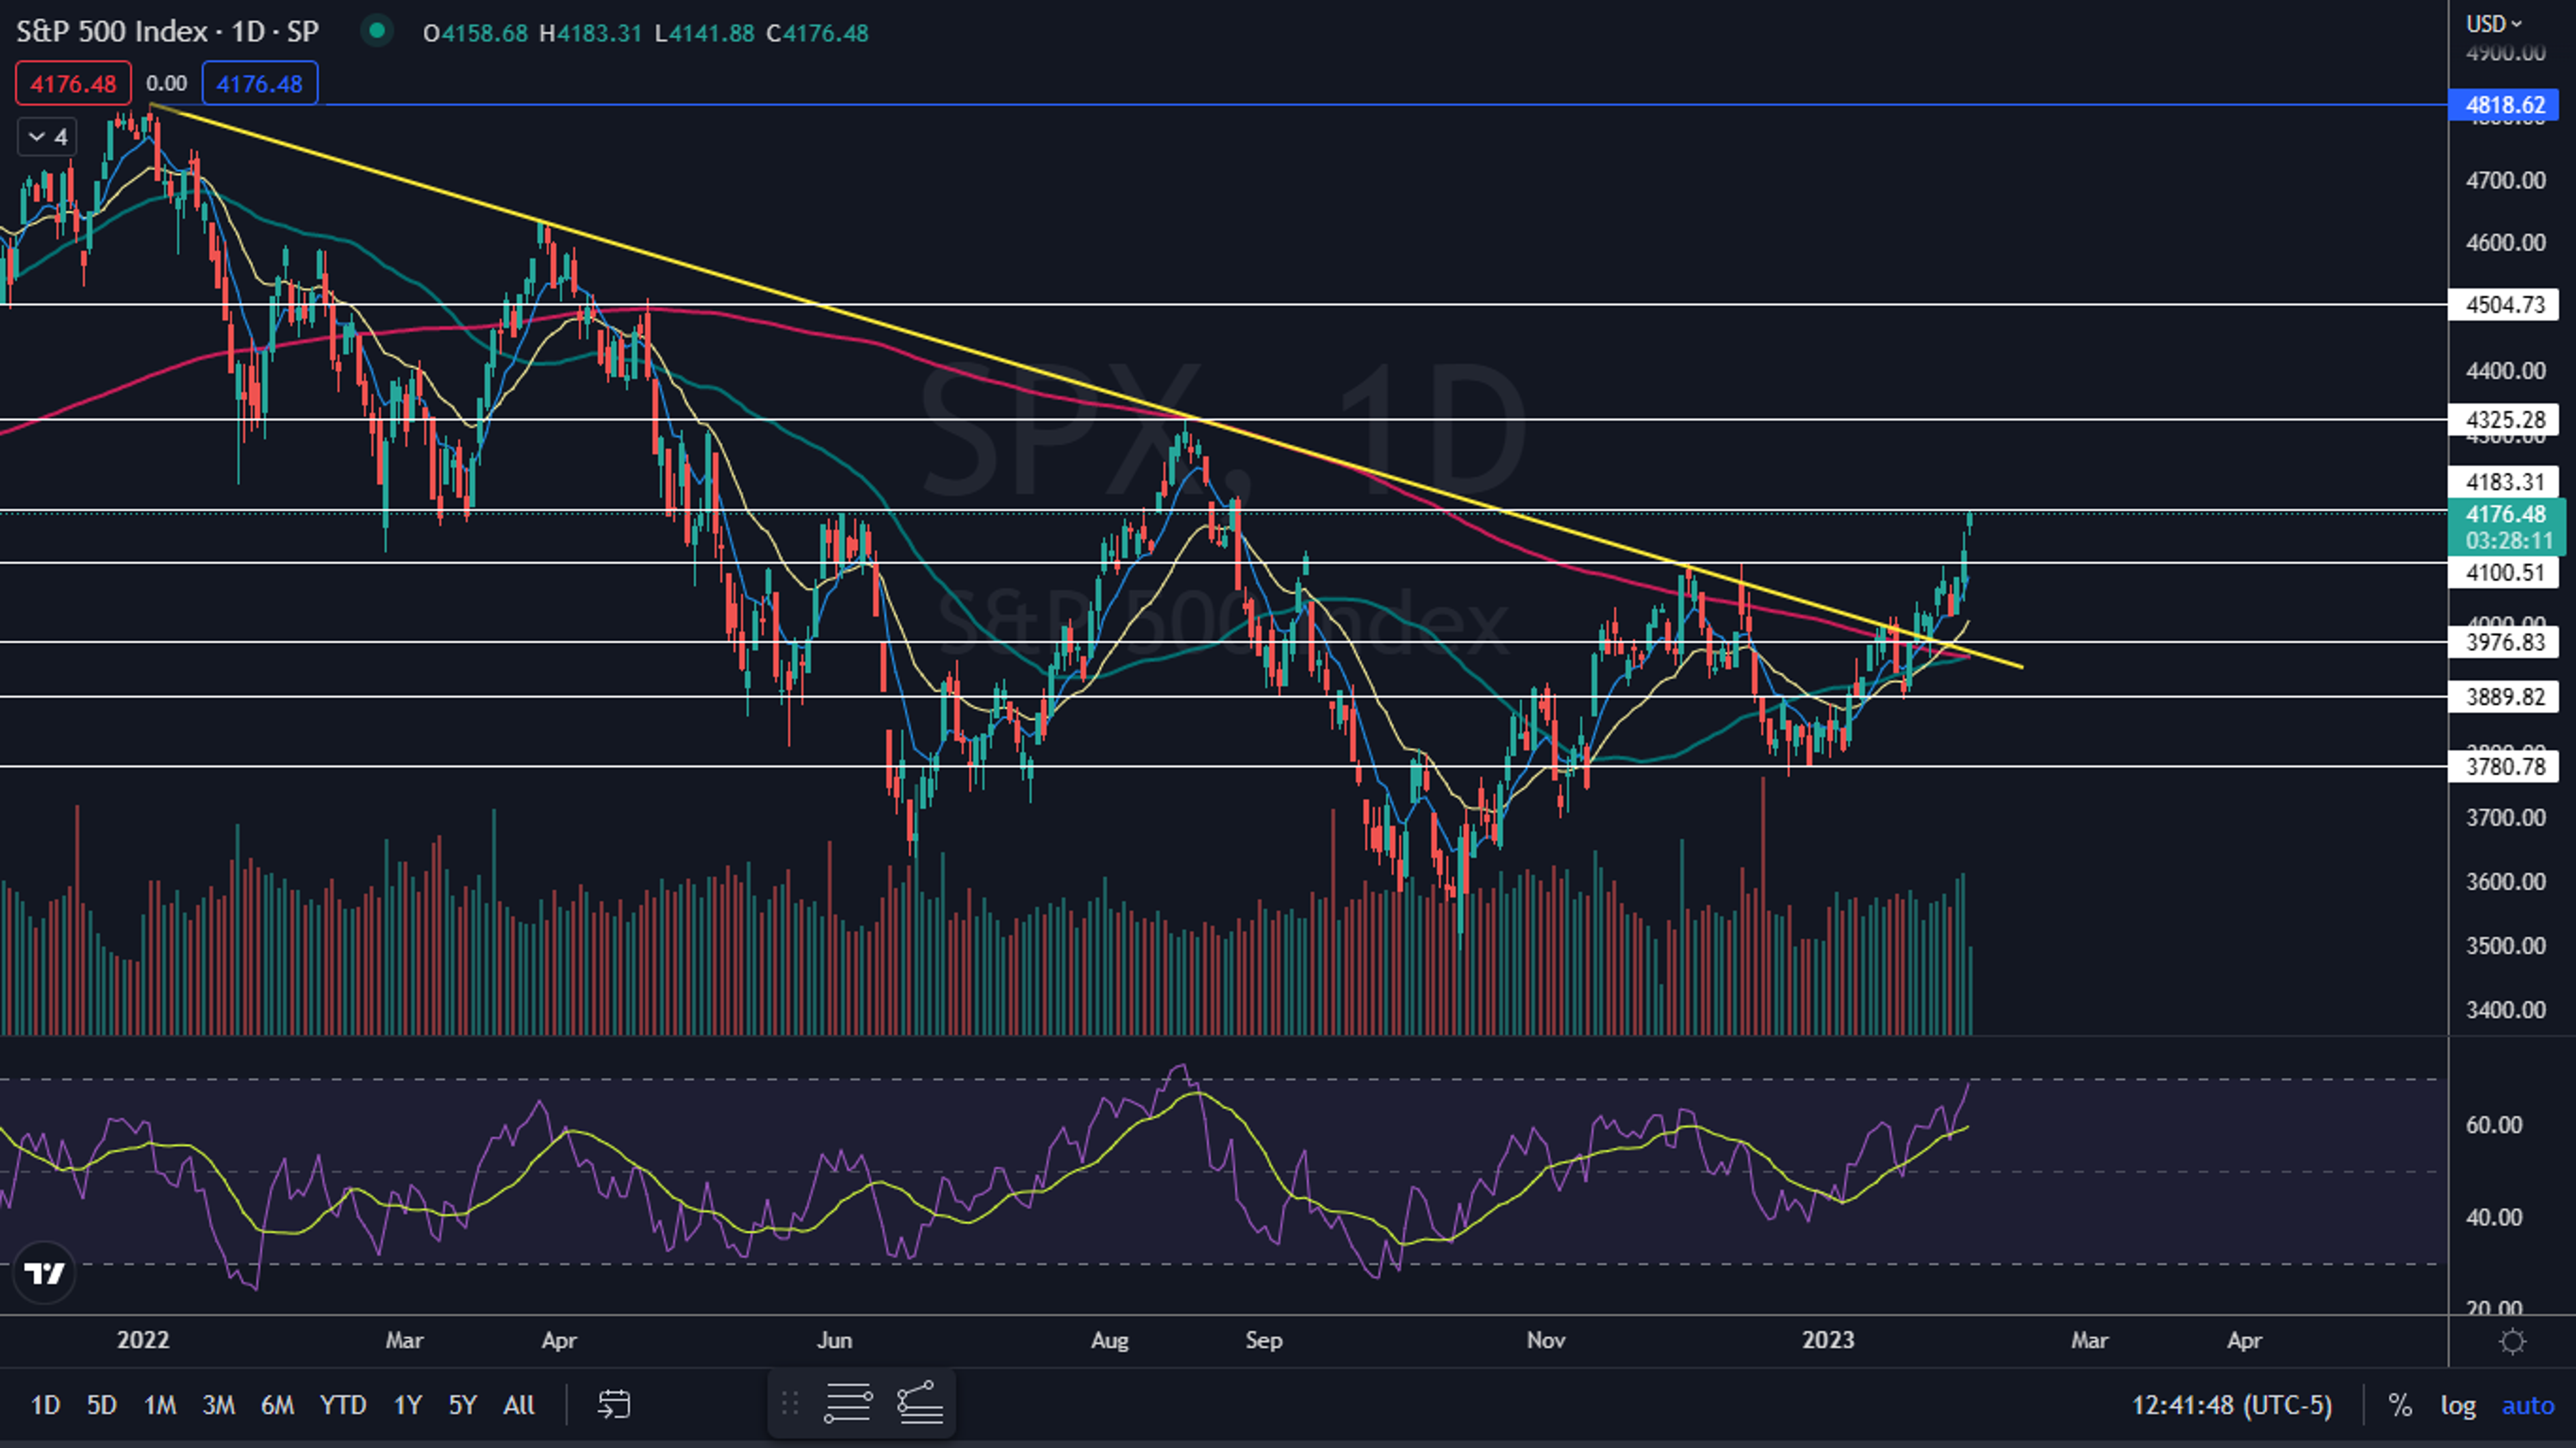
Photo via Shutterstock.
Edge Rankings
Price Trend
© 2025 Benzinga.com. Benzinga does not provide investment advice. All rights reserved.
Trade confidently with insights and alerts from analyst ratings, free reports and breaking news that affects the stocks you care about.

