
Zinger Key Points
- The SPY confirmed a new uptrend on Monday by printing a higher high.
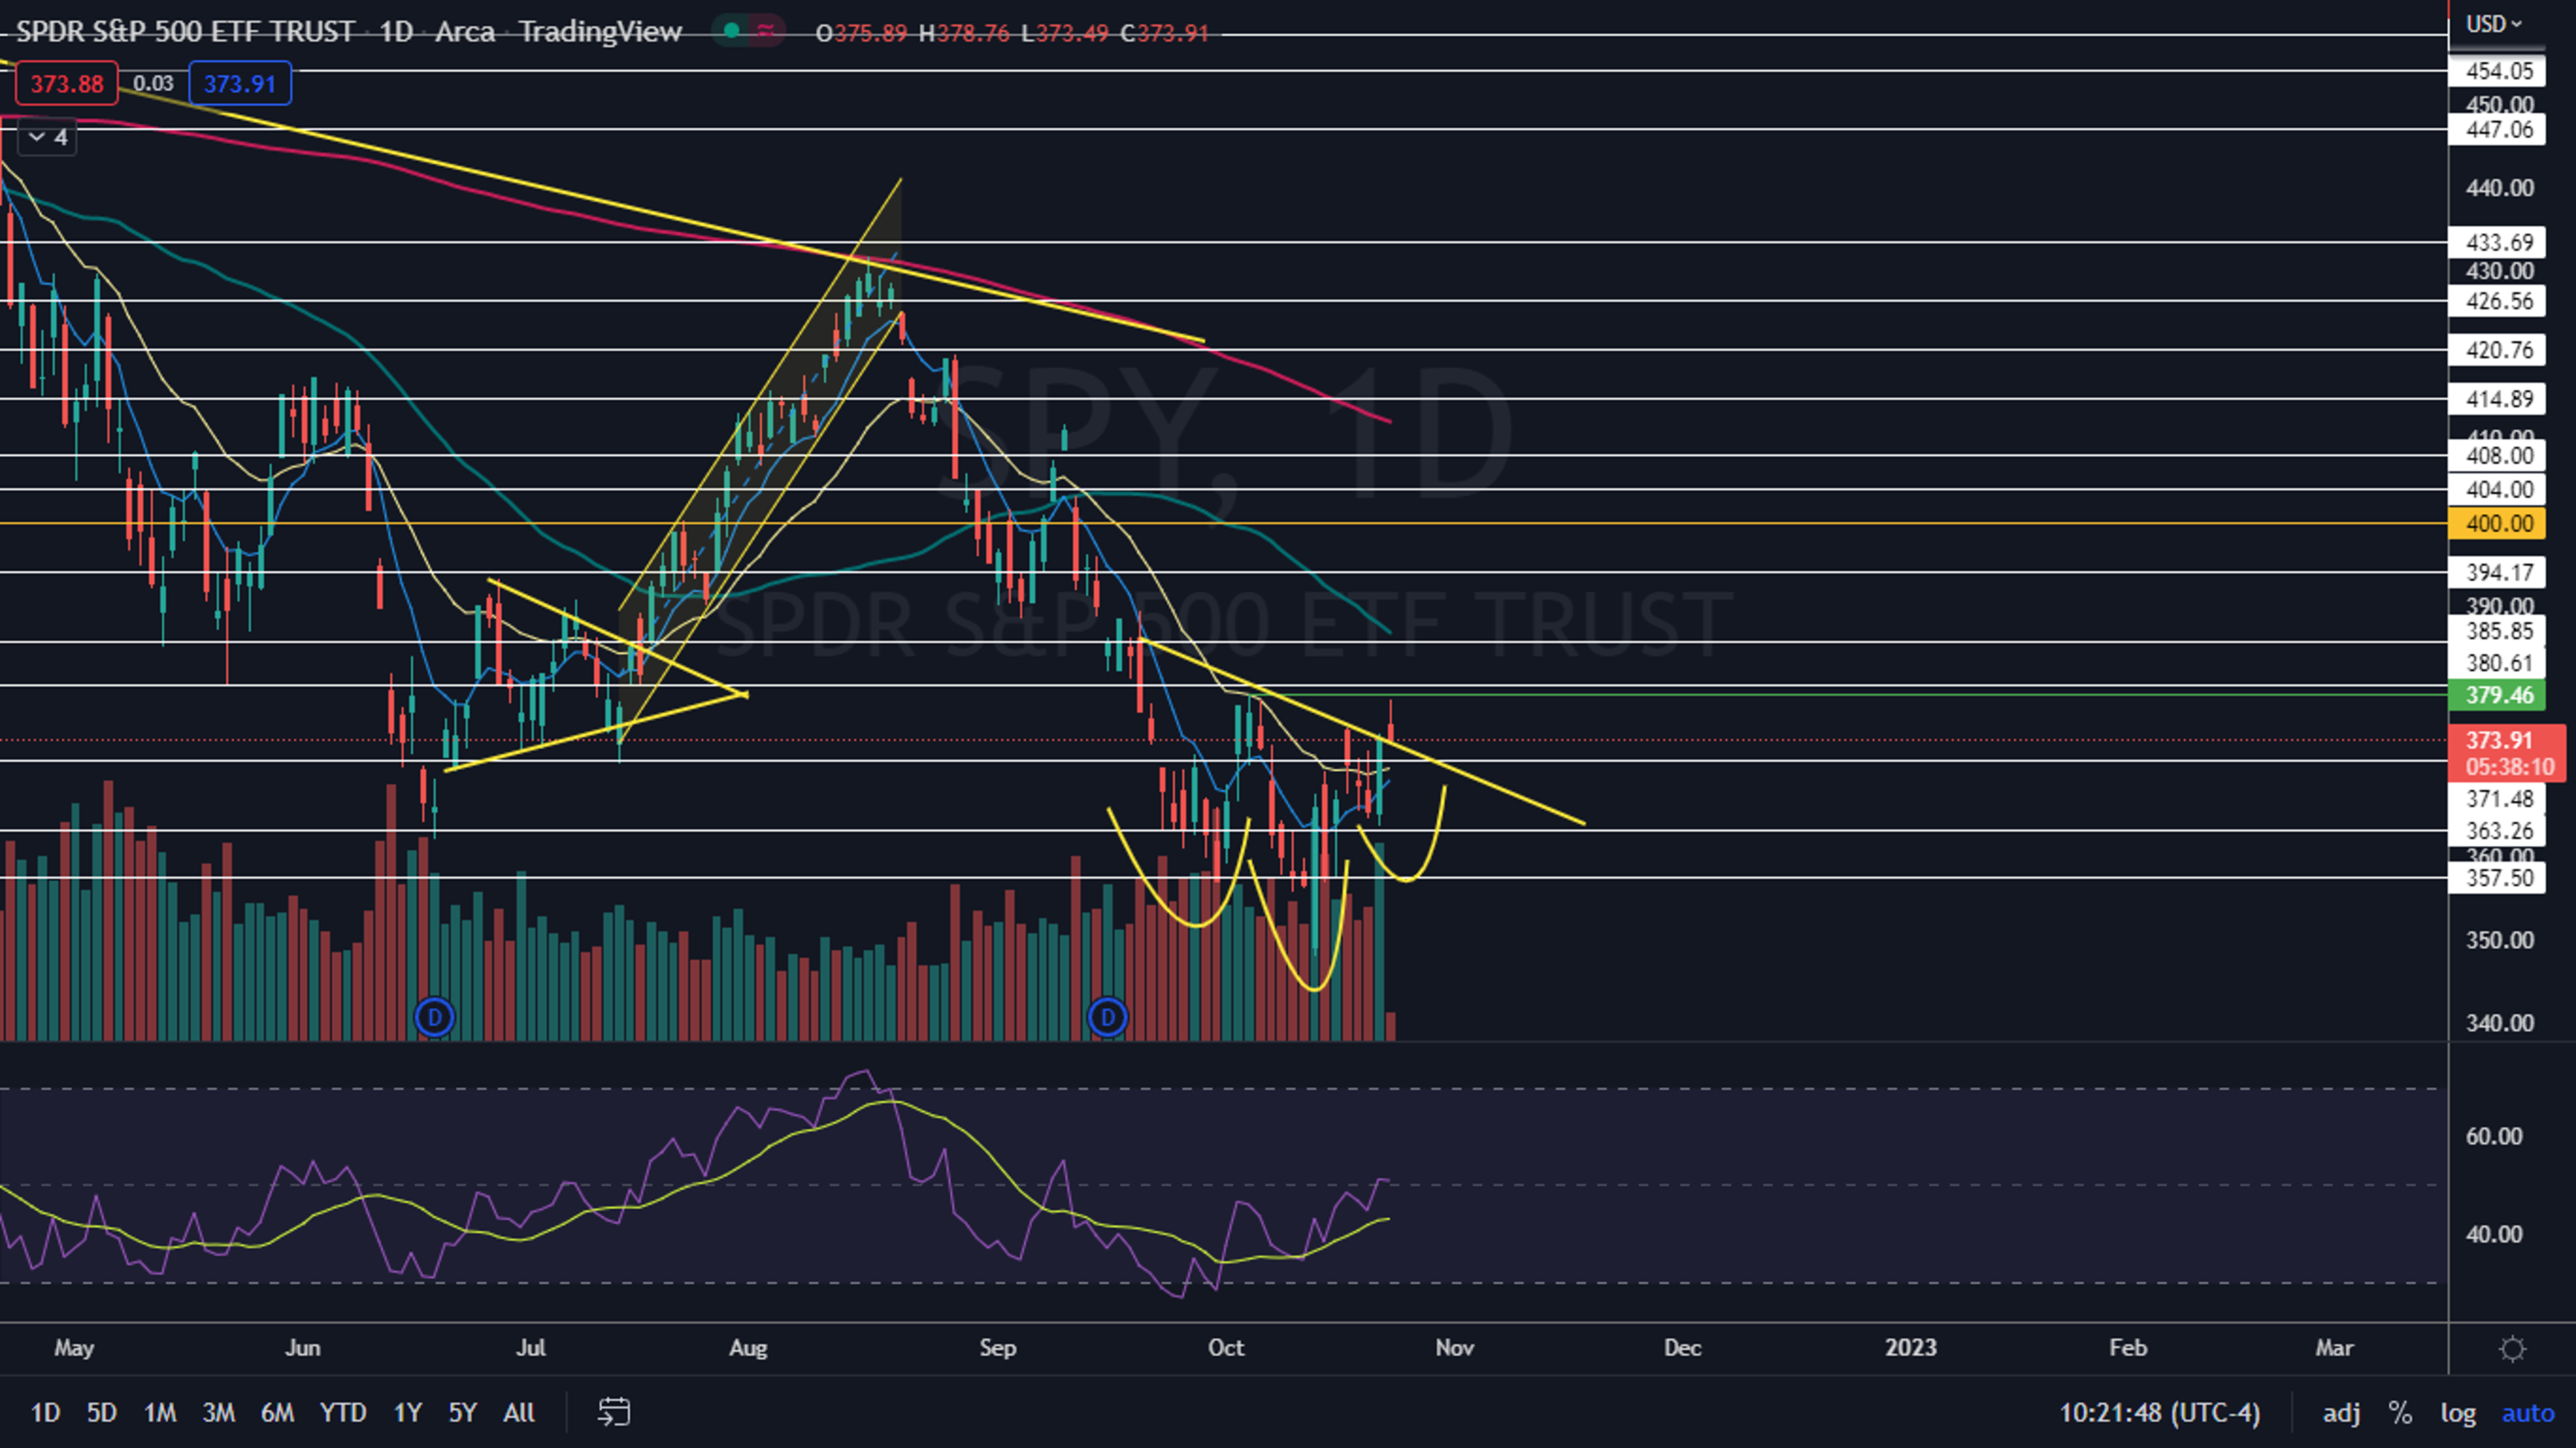
- The ETF was unable to break above
- Historic Summer Setup: 3 "Power Patterns" Triggering in the next 75 Days - Get The Details Now
The SPDR S&P 500 SPY gapped up slightly to start the trading session on Monday. It attempted to break up through the Oct. 5 high of 379.46 but rejected from slightly below the level.
Monday’s higher open is a continuation from Friday, where the SPY enjoyed a bullish day, rallying about 2.5%.
The higher prices on Monday caused the SPY to confirm that it’s trading in a new uptrend, with the formation of a higher high. The market ETF has traded in a number of short-term bull cycles within the longer-term bear market since the SPY fell more than 20% off its Jan. 4 all-time high, on June 13.
Want direct analysis? Find me in the BZ Pro lounge! Click here for a free trial.
The SPY’s inability to rise up above the Oct. 5 high-of-day may have caused the ETF to form a bearish double top pattern near the $379 level, which could indicate either a retracement is in the cards to print another higher low and continue in the uptrend, or that the bull cycle that began on Oct. 13 is over, and another downtrend will occur.
The SPY Chart: When the SPY was unable to spike above $379, the ETF ran into a group of sellers who caused the SPY to decline over 1% off the high-of-day and completely close the lower gap. If the SPY closes the trading day near to or below its opening price, the ETF will print a doji or shooting star candlestick, which could indicate lower prices will come on Tuesday.
- The SPY is trading in an uptrend, with the most recent higher high formed on Monday and the most recent higher low printed at the $363.54. If the SPY trades lower over the next few days, bullish traders will want to see the ETF print a bullish reversal candlestick above $364, to confirm the uptrend is still intact.
- Bearish traders want to see momentum to the downside to confirm the bearish double-top pattern was recognized. If the SPY falls under $363, the uptrend will be negated and the longer-term downtrend is likely to resume.
- There is a possibility the SPY has created a bullish inverted head-and-shoulder pattern on the daily chart. If the head-and-shoulders is the dominate pattern, the SPY broke up from the neckline on Monday and fell to back test the area as support.
- If the descending neckline of the head-and-shoulders pattern continues to hold as support, a larger reversal to the upside could be in the cards. If the SPY falls under the neckline the pattern will be negated.
- The SPY has resistance above at $380.61 and $385.85 and support below at $371.48 and $363.26.

Edge Rankings
Price Trend
© 2025 Benzinga.com. Benzinga does not provide investment advice. All rights reserved.
Trade confidently with insights and alerts from analyst ratings, free reports and breaking news that affects the stocks you care about.

