
Zinger Key Points
- The SPY is in need of consolidation after two bullish days caused the ETF to surge over 5%.
- Bullish traders will want to see the SPY regain support at the 21-day EMA.
- Discover the top trade setups and strategies beating the S&P this year —live this Wednesday at 6 PM ET. Reserve your free spot now.
The S&P 500 SPY was trading down about 1% in the premarket Wednesday after surging 5.86% off Friday’s closing price on Monday and Tuesday — the largest two-day increase since Feb. 25 and Feb. 26.
The recent rally has been a relief for bullish traders, who suffered a sharp decline between Aug. 16 and Sept. 30, where the SPY plunged 17.3% and took many individual stocks down with it.
The ETF entered into an official bear market on June 13, when the SPY ticked down a total of more than 20% off the all-time high of 479.98. Although there have been a number of shorter-term bull rallies since the Jan 4 high, the overall trend has been down.
How long the current bullish rally will last is yet to be seen but for a longer-term cycle to take place, the SPY will have to enter into periods of consolidation along the way.
Want direct analysis? Find me in the BZ Pro lounge! Click here for a free trial.
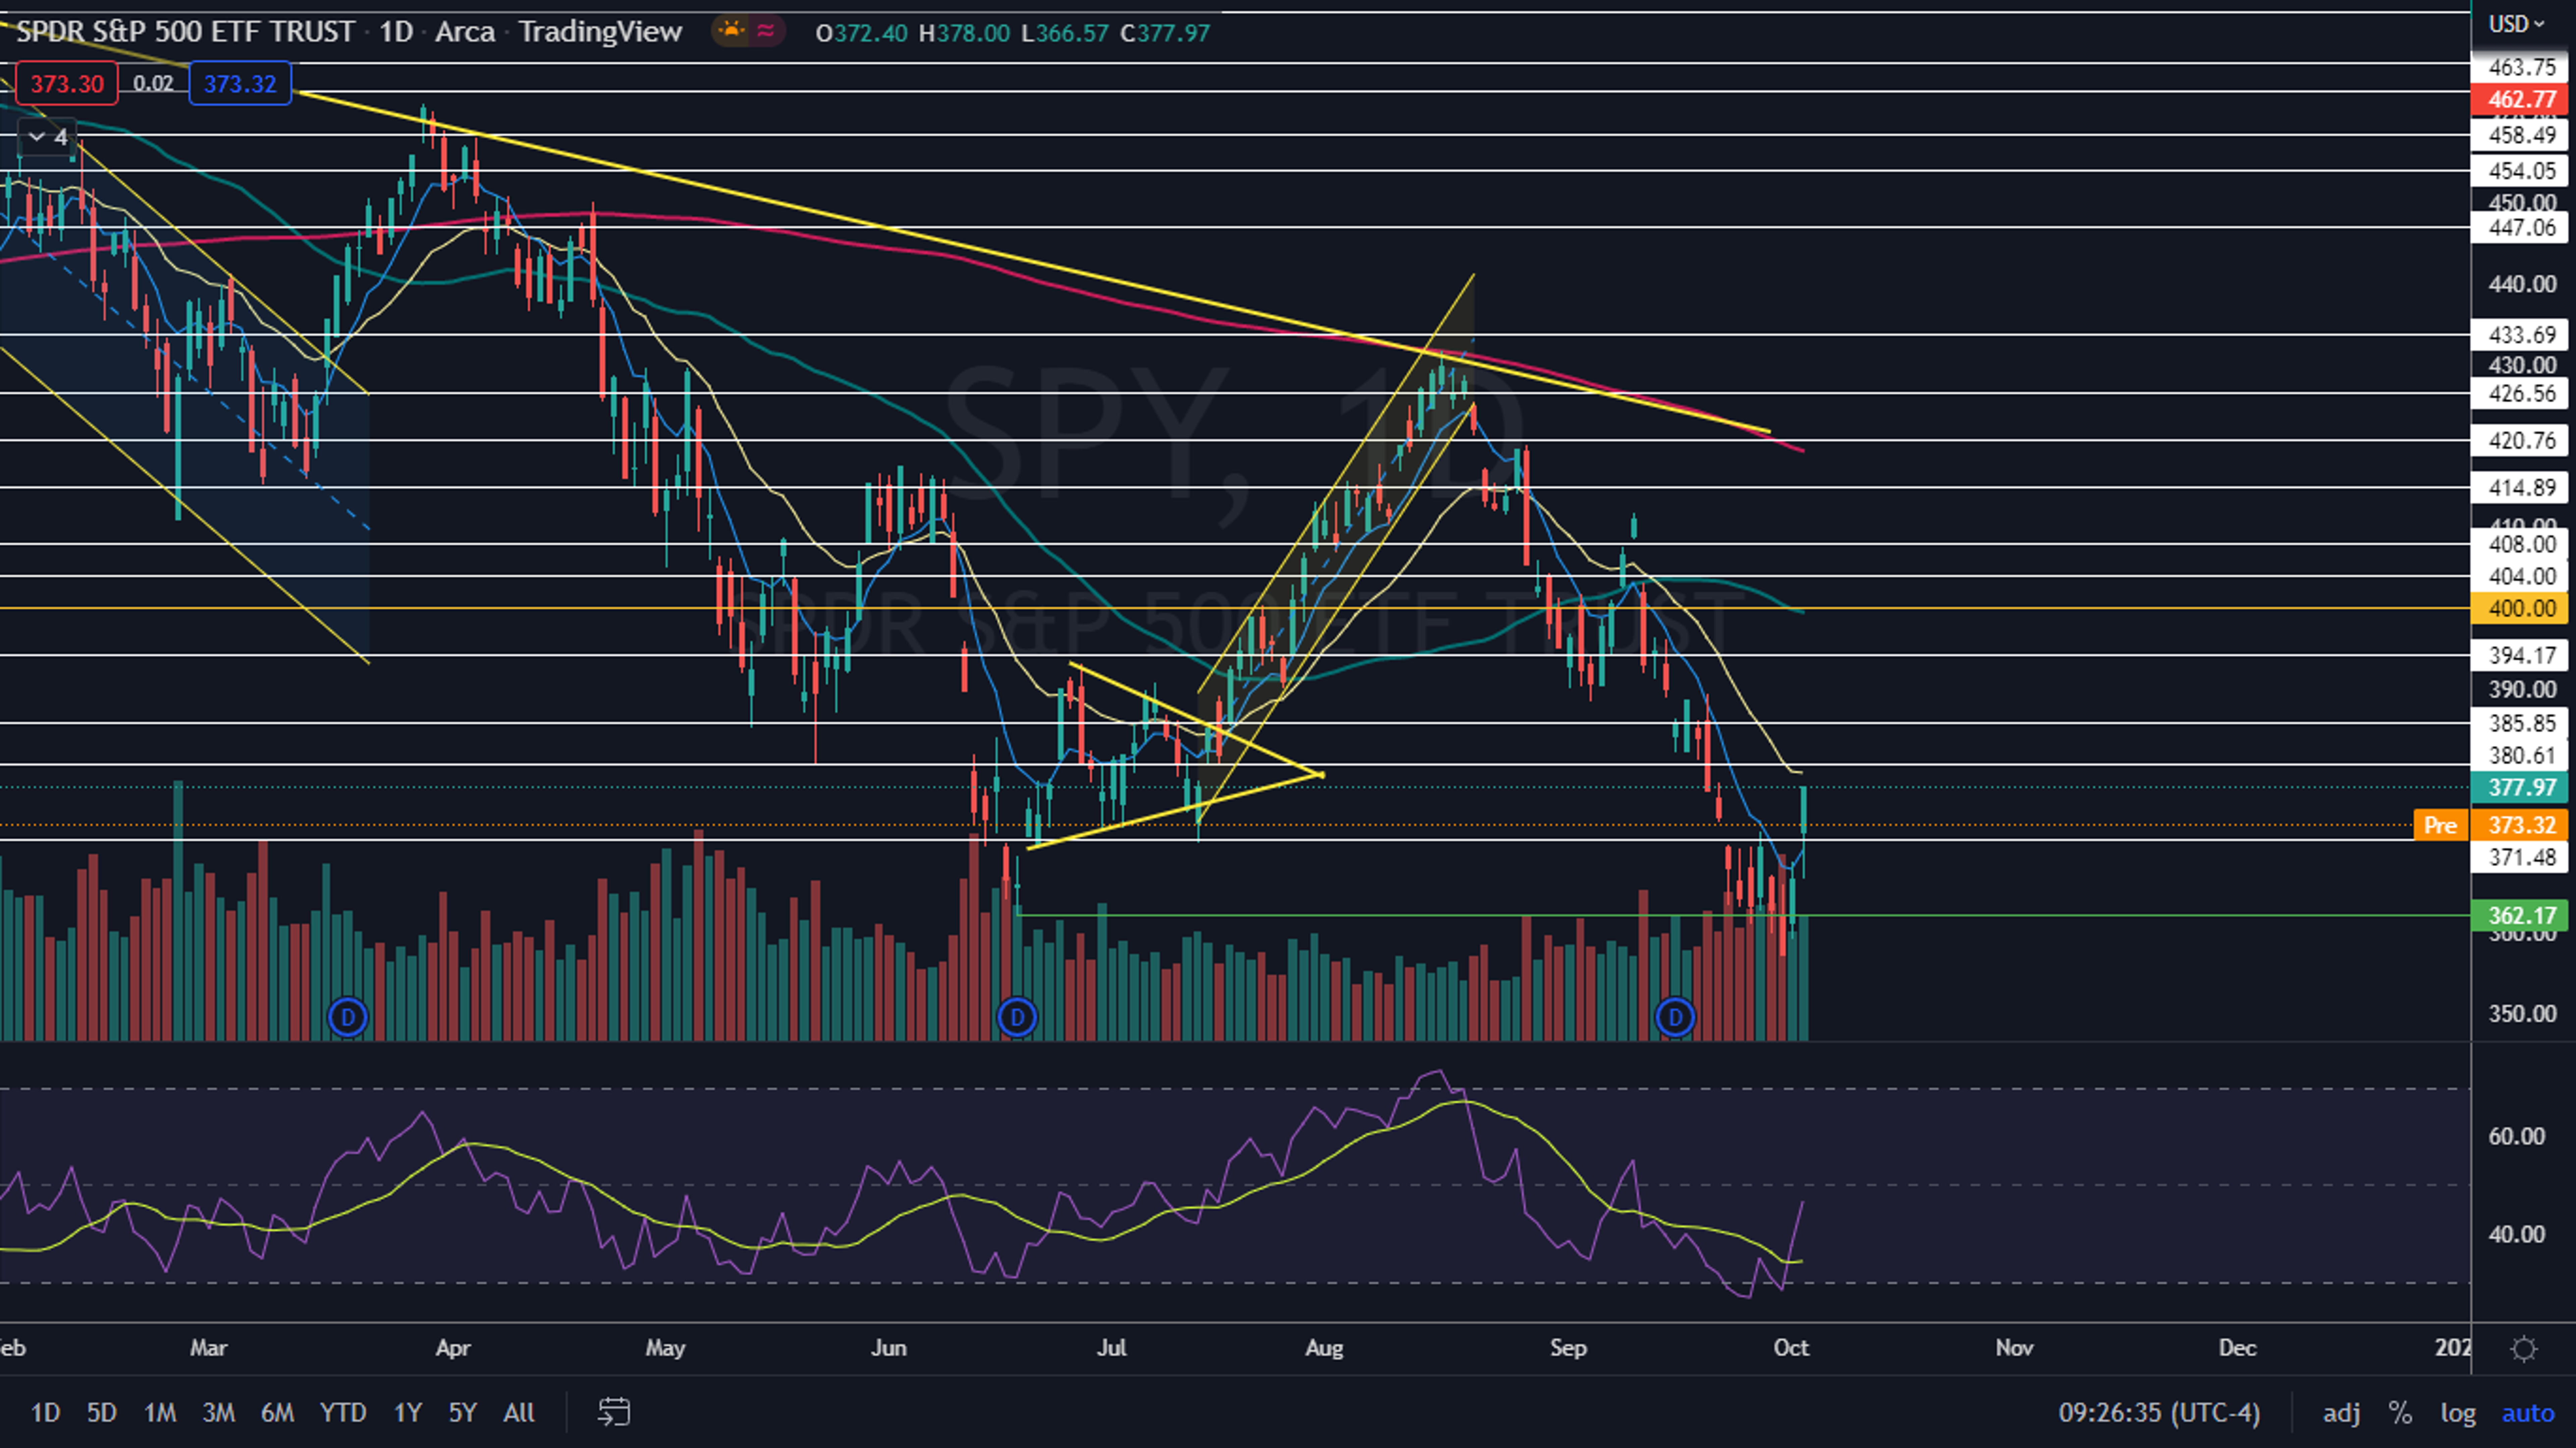
The SPY Chart: The SPY opened Wednesday’s trading session within Tuesday’s trading range, which has set the ETF into an inside bar pattern on the daily chart. An inside bar indicates consolidation when it takes place on lower-than-average volume. Consolidation is a positive sign for the bulls after the two-day rally.
- If the SPY continues to trade inside Tuesday’s mother bar for the remainder of Wednesday, traders can watch for a break up or down from the range on Thursday to gauge the future direction.
- If the inside bar develops near the top of the mother bar, the likelihood of a bullish break increases. If the inside bar develops near the bottom of Tuesday’s range, a bear break becomes the more likely scenario.
- The SPY regained the eight-day exponential moving average (EMA) as support on Tuesday, which is a positive sign for the bulls. If the SPY is able to regain the 21-day EMA over the coming days and trade above the area for a period of time, the eight-day EMA will cross above the 21-day, which would be bullish.
- If the SPY continues to reject the 21-day EMA, it may signal the end of the rally and a downtrend could resume.
- The SPY has resistance above at $380.61 and $385.85 and support below at $371.48 and $362.17.

Edge Rankings
Price Trend
© 2025 Benzinga.com. Benzinga does not provide investment advice. All rights reserved.
Trade confidently with insights and alerts from analyst ratings, free reports and breaking news that affects the stocks you care about.

