
Zinger Key Points
- The Bank of England announced a plan to purchase bonds to stabilize the markets.
- GLD reacted bullishly and consolidating on Thursday in an inside bar pattern.
- Historic Summer Setup: 3 "Power Patterns" Triggering in the next 75 Days - Get The Details Now
The SPDR Gold Trust GLD experienced some volatility intraday trading up and down within Wednesday’s range.
Gold, which correlates to bond prices, has been in decline recently, while yields have soared. Yields, which track inversely to gold, have been rising amid a series of 0.75% interest rate hikes as the Federal Reserve continues in its attempt to bring down inflation.
On Wednesday, the Bank of England announced it will cease selling bonds next week and start to purchase long-dated bonds. The U.K. stock market has experienced high volatility recently, which could impact the U.S. markets. The move to purchacse bonds is an attempt to stabilize the markets.
See Also: Bank Of England Begins Purchasing UK Bonds To Stabilize Market, 10-Year US Treasury Rates Hit 4%
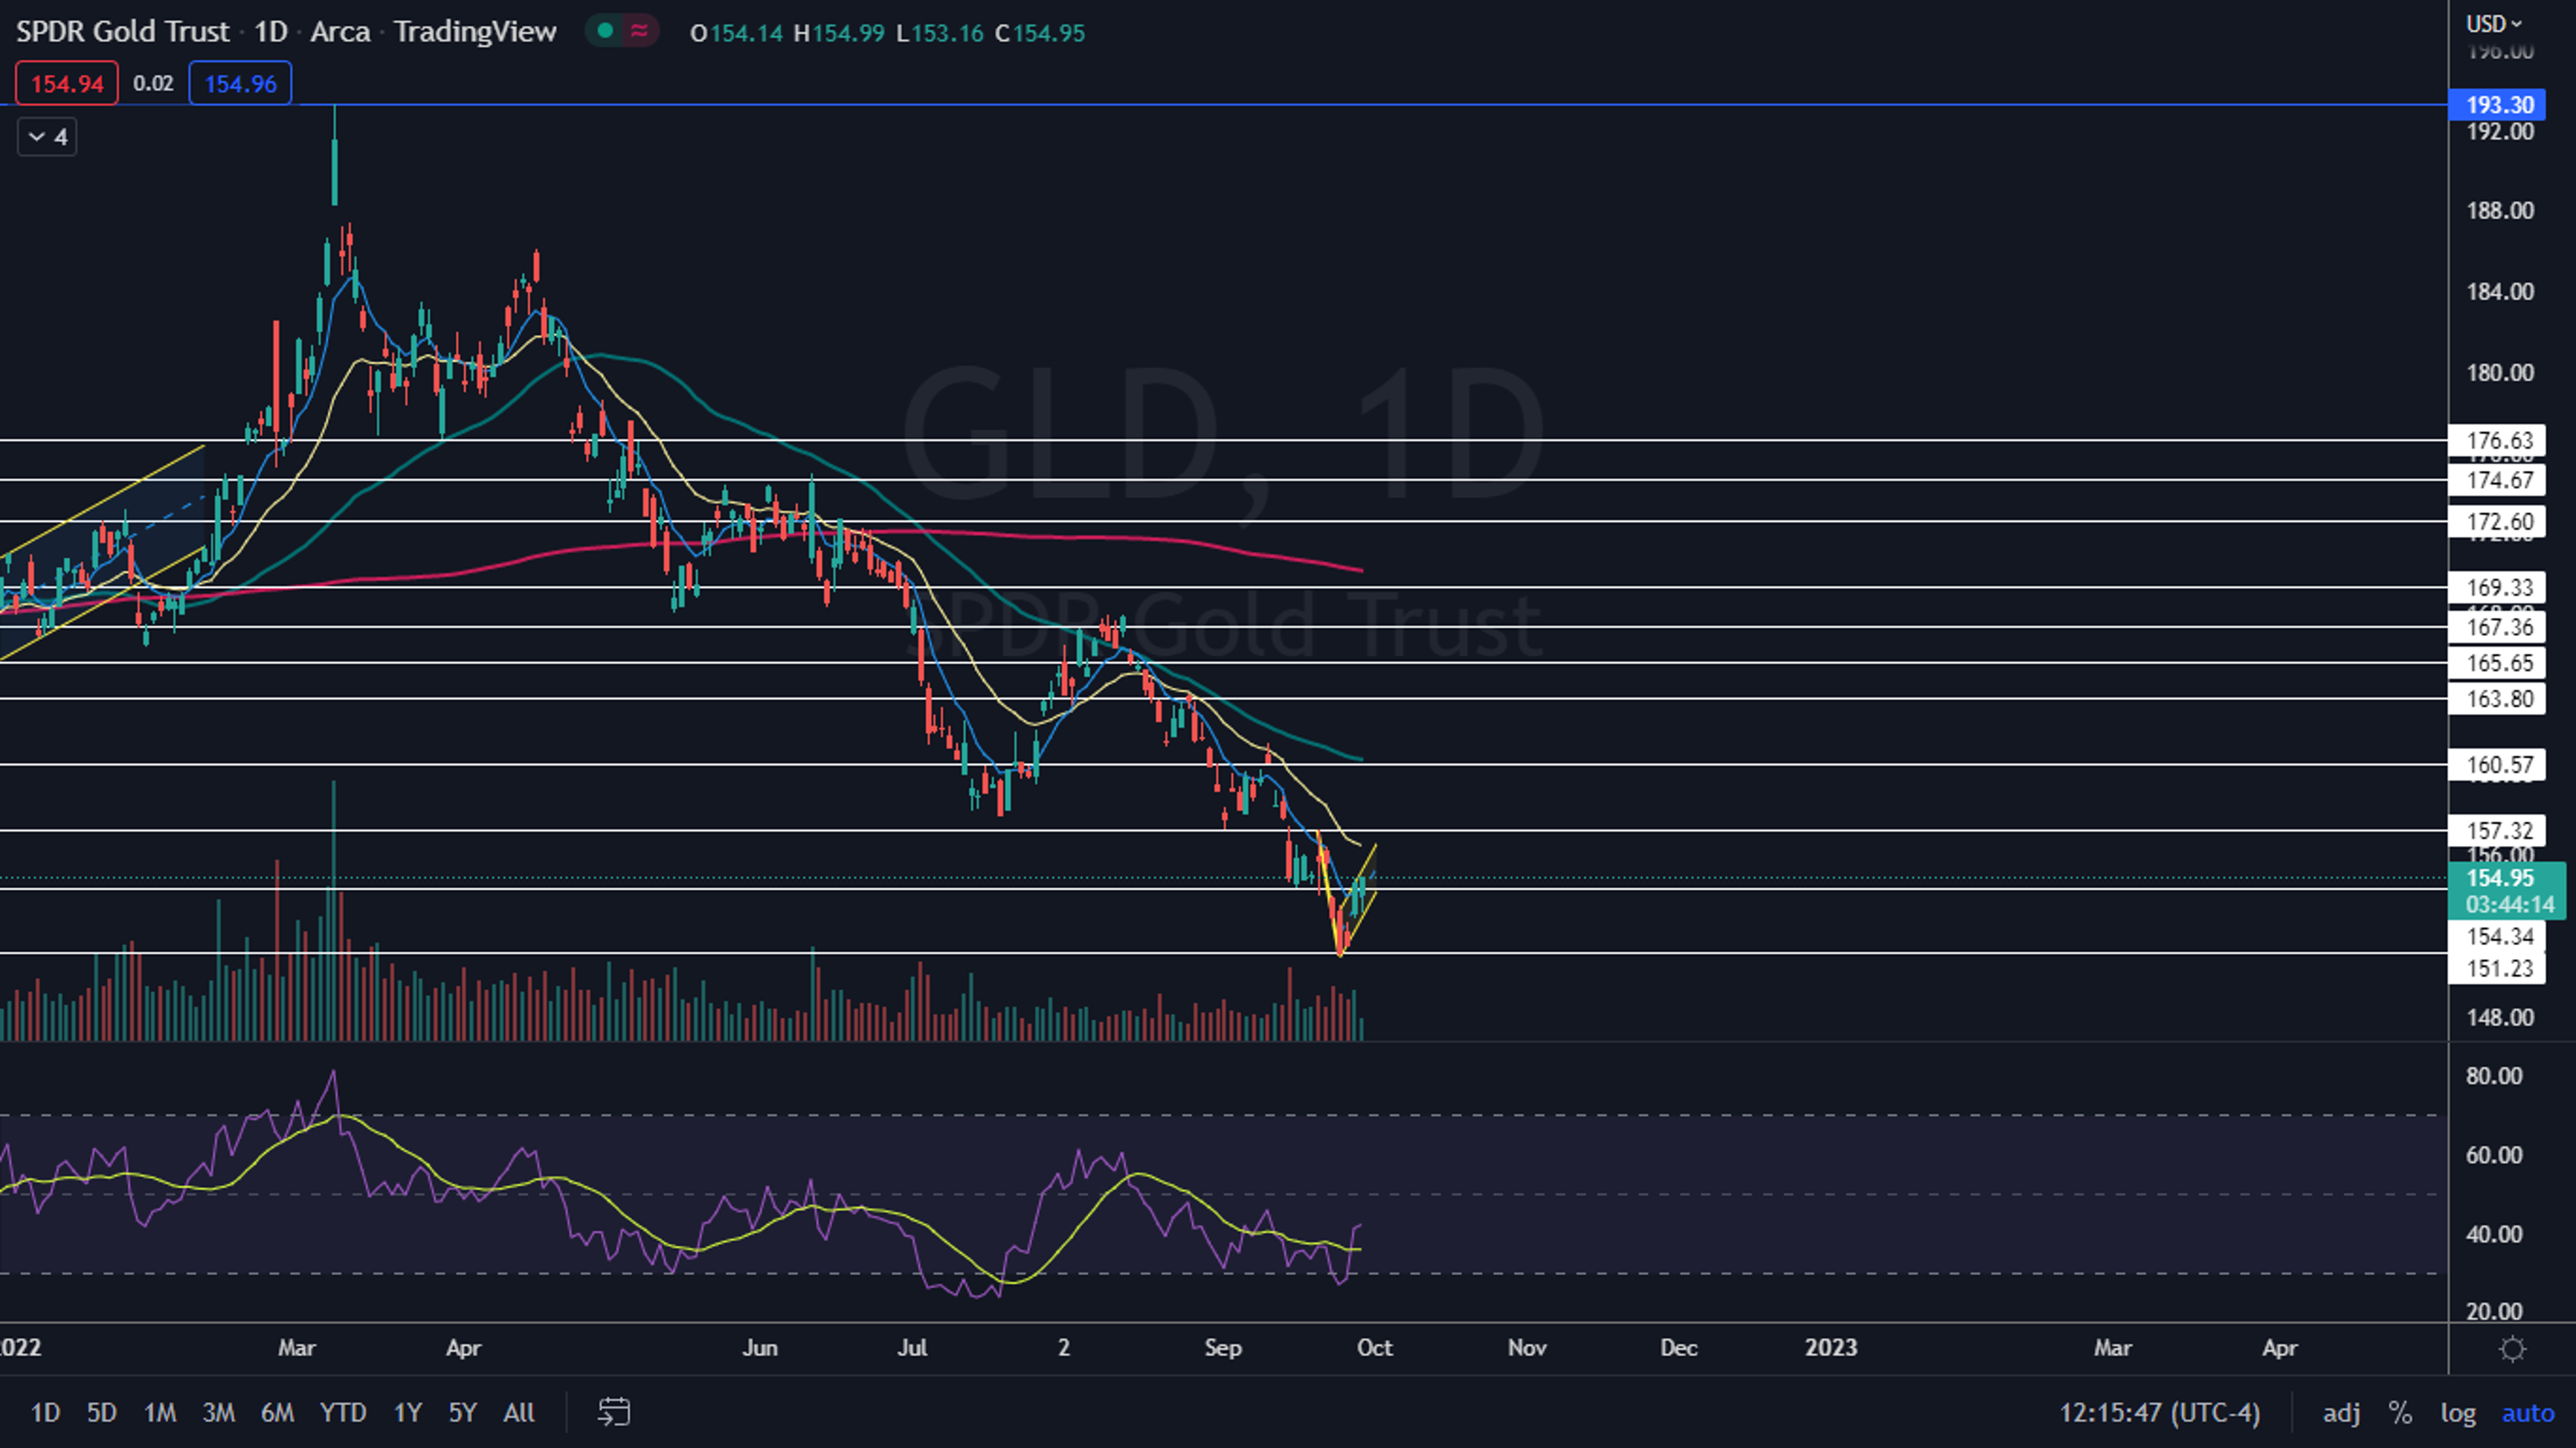
GLD is trading down about 20% from its March 8 high of $193.30, where the fund printed a bearish double top pattern when paired similar price action on Aug. 6, 2020 that occurred at the all-time high of $194.45.
Today's Best Finance Deals
A double top pattern is a reversal indicator that shows a stock has reached a key resistance level, retraced lower, back tested the level as resistance and is likely to retrace again. It is possible the stock or fund may retest the level as resistance again creating a triple top or even quadruple top pattern.
The formation is always identified after a security has reached a price and is at the top of an uptrend whereas a bullish double bottom pattern is always found in a downtrend. A spike in volume confirms the double top pattern was recognized and subsequent increasing volume may indicate the stock will retrace into a downtrend.
- Aggressive bearish traders may choose to take a position when the stock’s volume spikes after the second retest of the resistance level. Conservative bearish traders may wait to take a position when the stock’s share price has dropped below the level of the second rebound (the high of the first bounce after the double top has formed).
- Bullish traders may choose to take a position if the stock surpasses the level at which the double top was formed, which can indicate a larger reversal to the upside is on the horizon.
- Want direct analysis? Find me in the BZ Pro lounge! Click here for a free trial.
The GLD Chart: On Sept. 26, GLD made a new 52-week low at the $151.03 level and on Sept. 27 formed an inside bar. The inside bar broke up bullish on Wednesday and on Thursday, the fund was printing another inside bar pattern.
- The most recent inside bar leans bullish because GLD was trading higher before forming the pattern but traders can watch for a break up or down from Wednesday’s mother bar later on Thursday or on Friday to gauge future direction.
- If GLD breaks up bullishly from the inside bar pattern, the fund will regain the eight-day exponential moving average (EMA), which will give bullish traders more confidence. If the fund can hold above the level for a period of time, a possible bear flag that has developed on GLD will also be negated.
- GLD has resistance above at $157.32 and $160.57 and support below at $154.34 and $151.23.

Edge Rankings
Price Trend
© 2025 Benzinga.com. Benzinga does not provide investment advice. All rights reserved.
Trade confidently with insights and alerts from analyst ratings, free reports and breaking news that affects the stocks you care about.

