
United Airlines Holdings Inc UAL shares are trading lower Monday, likely a continuing momentum after the company had an airplane lose an engine while flying over Colorado.
United Airlines was down 3.59% at $46 at last check Monday.
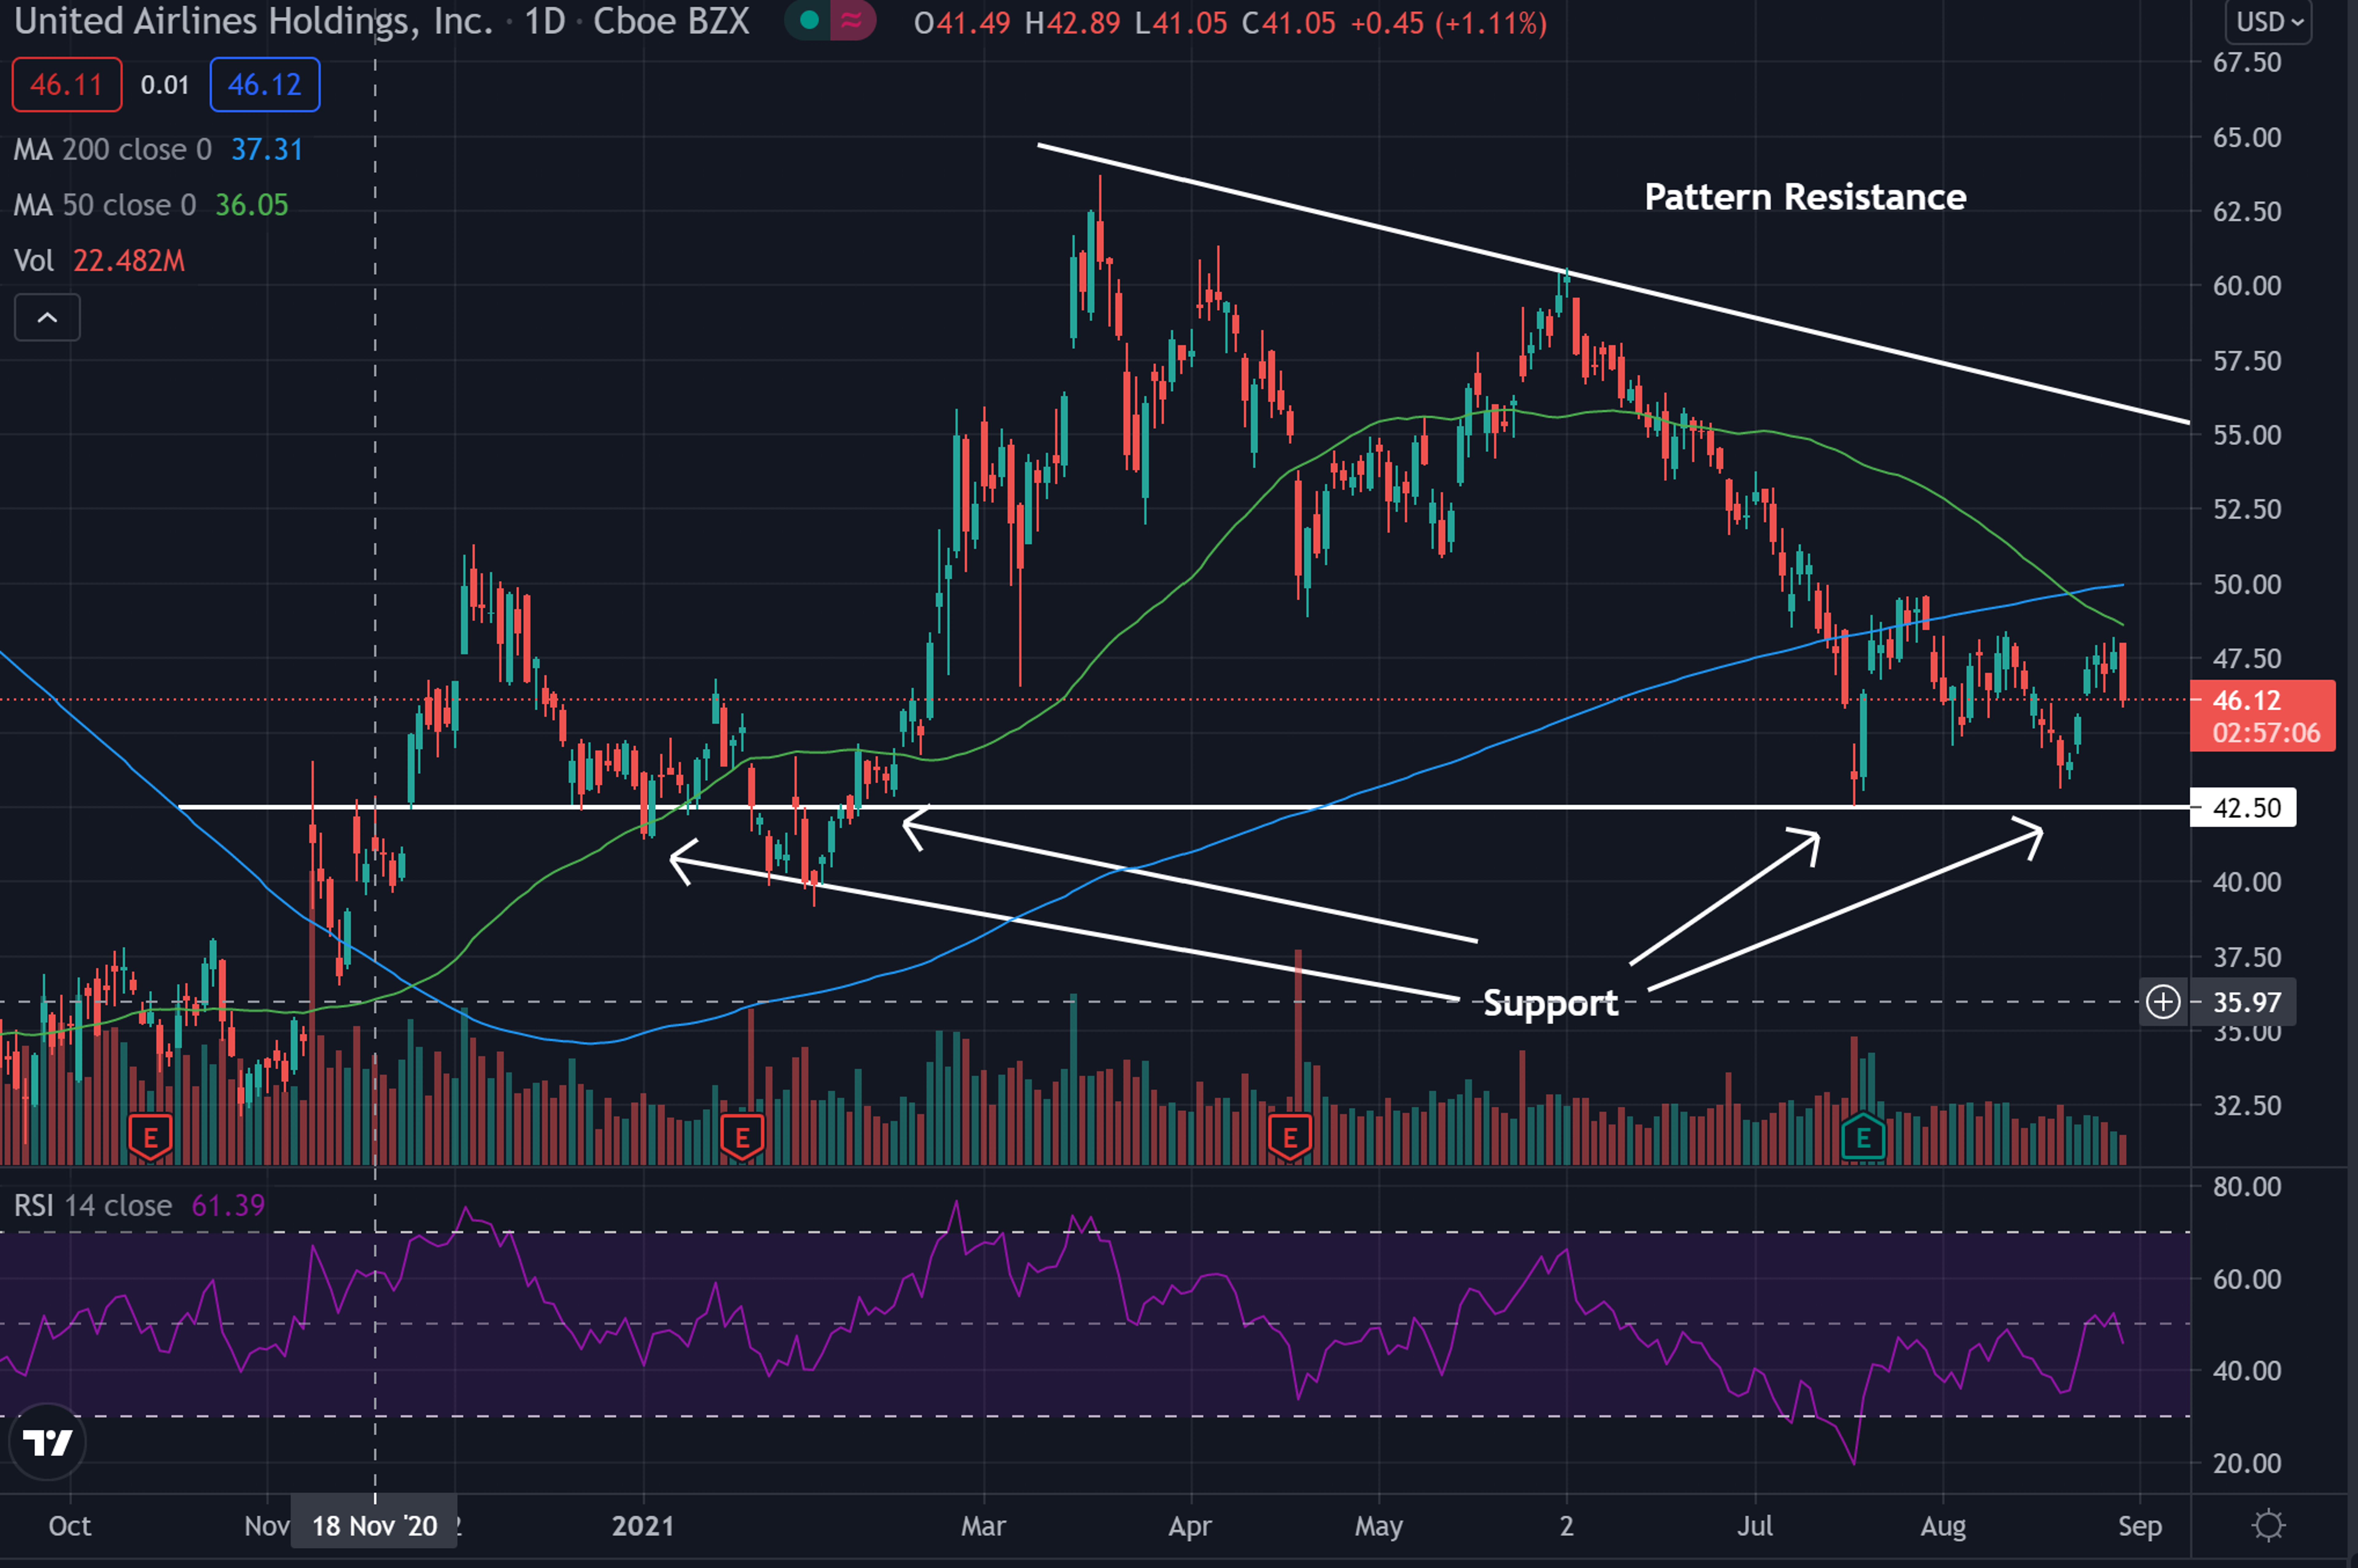
United Airlines Daily Chart Analysis
- The stock looks to be nearing the support in what technical traders call a descending triangle pattern.
- The $42.50 price level has held as support multiple times in the past and may again in the future. The stock has been getting pushed down by pattern resistance toward this support level.
- The stock trades below both the 50-day moving average (green) and the 200-day moving average (blue), indicating the stock is likely facing a period of bearish sentiment.
- Each of these moving averages may hold as a potential area of resistance in the future.
- The Relative Strength Index (RSI) has been falling recently and now sits at 45. This shows there are more sellers in the stock than there are buyers.

What’s Next For United Airlines?
Bullish traders are looking to see the stock bounce and start to form higher lows. Bulls would then like to see the stock break above the pattern resistance to potentially see a change in trend.
Bearish traders would like to see the stock continue to fall lower on the downward trend the stock has been on. Bears would like to see the stock fall below support and for the area to begin to hold as resistance. This could cause a further downward push.
Edge Rankings
Price Trend
© 2025 Benzinga.com. Benzinga does not provide investment advice. All rights reserved.
Trade confidently with insights and alerts from analyst ratings, free reports and breaking news that affects the stocks you care about.

