
AMC Entertainment Holdings Inc. (NYSE:AMC) shares traded lower Wednesday on continued momentum as retail traders moved the stock. Over the past five sessions, AMC's stock has moved from the $49.40 level to its most recent close of $33.43
Below is a technical look at the stock.

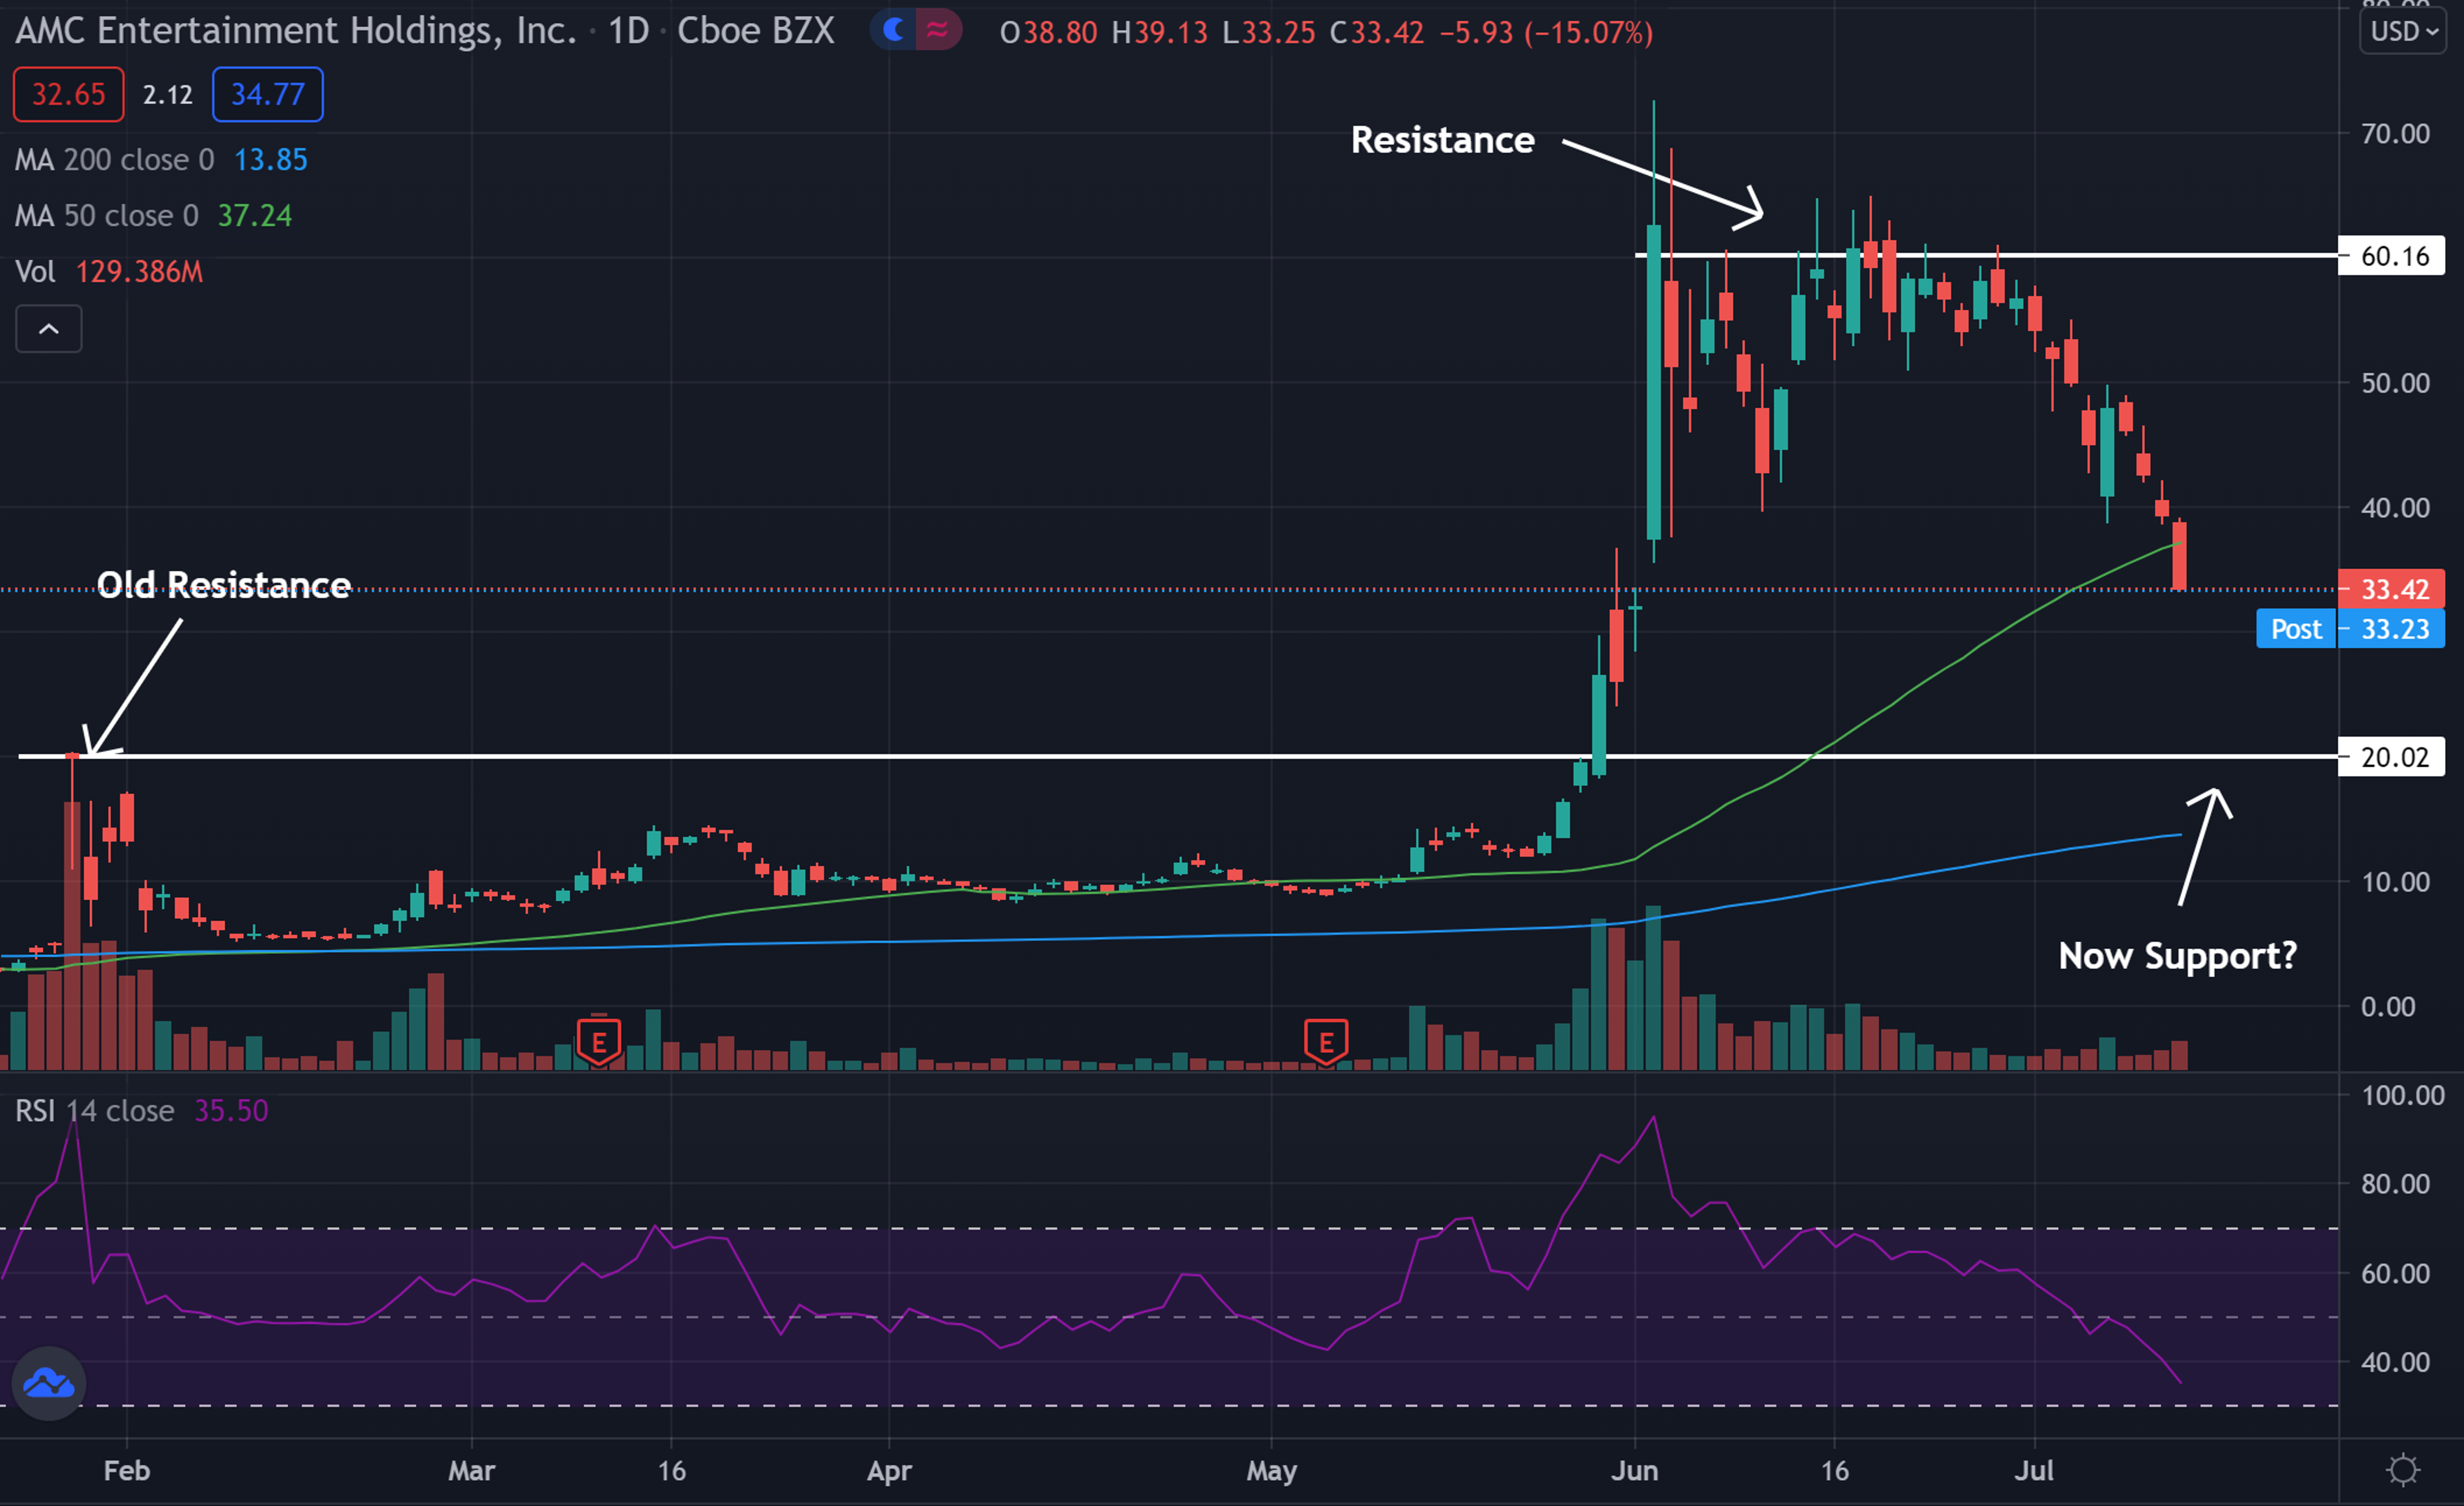
AMC Entertainment Holdings Daily Chart Analysis
- Shares have been trading in a sideways channel and have been falling toward support throughout the past few weeks.
- The stock crossed below the 50-day moving average (green) Wednesday, and trades above the 200-day moving average (blue), indicating the stock is likely entering a period of consolidation.
- The 50-day moving average may act as resistance, while the 200-day moving average may hold as an area of support.
See Also: Understanding The Pandemic Stock Trading Boom: Survey Profiles New Generation Of Investors
Key AMC Entertainment Holdings Levels To Watch
- The stock is falling toward support, potentially near the $20 level.
- The stock may find resistance near the $60 level if it's able to turn around and start heading higher.
- The Relative Strength Index (RSI) sits at 35 and has been falling throughout the past few weeks. Recently, there have been more sellers in the stock than buyers. If the RSI crosses below 30, it will enter into the oversold zone.
What’s Next For AMC Entertainment Holdings?
Bulls would like to see the stock bounce near support and start heading higher. Bulls would like to see the stock start forming higher lows and head toward resistance. Eventually, bulls would like to see the stock cross above the $60 resistance.
Bearish traders would like to see the stock fail to hold above the $20 level and start heading lower. If the stock can break below this level and the 200-day moving average, it could see a stronger bearish push.
© 2025 Benzinga.com. Benzinga does not provide investment advice. All rights reserved.