
Monday saw a broad sell-off in stocks as NYSE decliners outpaced advancers about 5 to 1. However, some stocks switched sides as the margin changed closer to 4 to 1. In a time of year that tends to be a little more laid back, the bears appear to be spoiling the holiday joy.
The S&P 500 (SPX) fell 1.65% and broke through its 50-day moving average but bounced off the 100-day moving average to close 1.14% lower. However, the Nasdaq Composite (GIDS) fell 1.24% and continues to trade below its 100-day moving average. Finally, the Dow Jones Industrial Average ($DJI) fell 1.70% but bounced from its 200-day moving average to close 1.23% lower on the day. As the major indices traded off their lows, the VIX (Cboe Market Volatility Index) fell from about 28 to just below 23, suggesting that the bulls were waking up.
While these moving averages are widely followed technical levels, they’re all trading relatively close together, so breaking through them may not have the same weight as when they’re more spread out. A convergence of these moving averages may be more of a reflection of market indices that are slowly trending higher with wider swings between peaks and troughs than a breakdown in the equity market.
All major S&P 500 stock sectors were in the red most of the day with defensive sectors experiencing the smallest losses, including consumer staples, utilities, health care, and real state. By the close, consumer staples and utilities were slightly positive. Energy stocks were in the middle of the pack despite oil prices (/CL) falling about 5.7% in the morning session. However, oil rallied off those bottoms and closed the day down 2.30%.
Financials were the worst-performing sector despite the 10-year Treasury yield (TNX) rallying off its morning low and closing the day 1.21% higher. The 10-year yield is right at a support level that appears to be holding.


Taking the L
Speaking of yields, and looking across bond market maturities, there was very little bond buying for such a down day in the stock market, and in fact, bonds sold off into the close. When investors “flee” an asset class, you can often look around the financial markets and determine where investors are going. In this case, investors don’t look like they’re going anywhere. Outside of bonds, investors often buy gold when they’re bearish, but that didn’t happen either because gold futures (/GC) were down 0.83%.
Some commentators in the financial news were attributing the sell-off to rising Omicron COVID-19 cases. Others saw it as a reaction to President Biden’s Build Back Better bill failure. No doubt, those news items likely contributed to the sell-off, but it could be that the selling was a result of tax-loss harvesting.
You may remember that tax-loss harvesting occurs when investors sell losing positions to realize or “harvest” losses and then use those losses to offset gains realized from the rest of their portfolio during the tax year. This could potentially lower the amount of taxes an investor owes. I warned in my December Outlook that tax-loss harvesting could cause some volatility as the year ended. If this is a driver for today’s selling, then the selling might be temporary.
Without seeing another asset class benefiting from the sell-off, it could be that many investors are going into cash because they’re taking losses for tax purposes. It may seem like a Scroogey thing to do this time of year, but some investors might say it’s “a poor excuse for picking a man’s pocket every 25 of December.”
Small Stock Support
Looking for a bit of hope, the Russell 2000 (RUT) small-cap index fell below support on Monday, but the bulls rallied back above support. If the bulls can hold this level, it could be a good sign for small-cap stocks. I’ve mentioned before that small-caps tend to outperform in January and February under the phenomenon known as the January Effect. Of course, this doesn’t happen every year, but it makes sense to keep an eye on these small-cap stocks in December to see if investors start accumulating shares early.
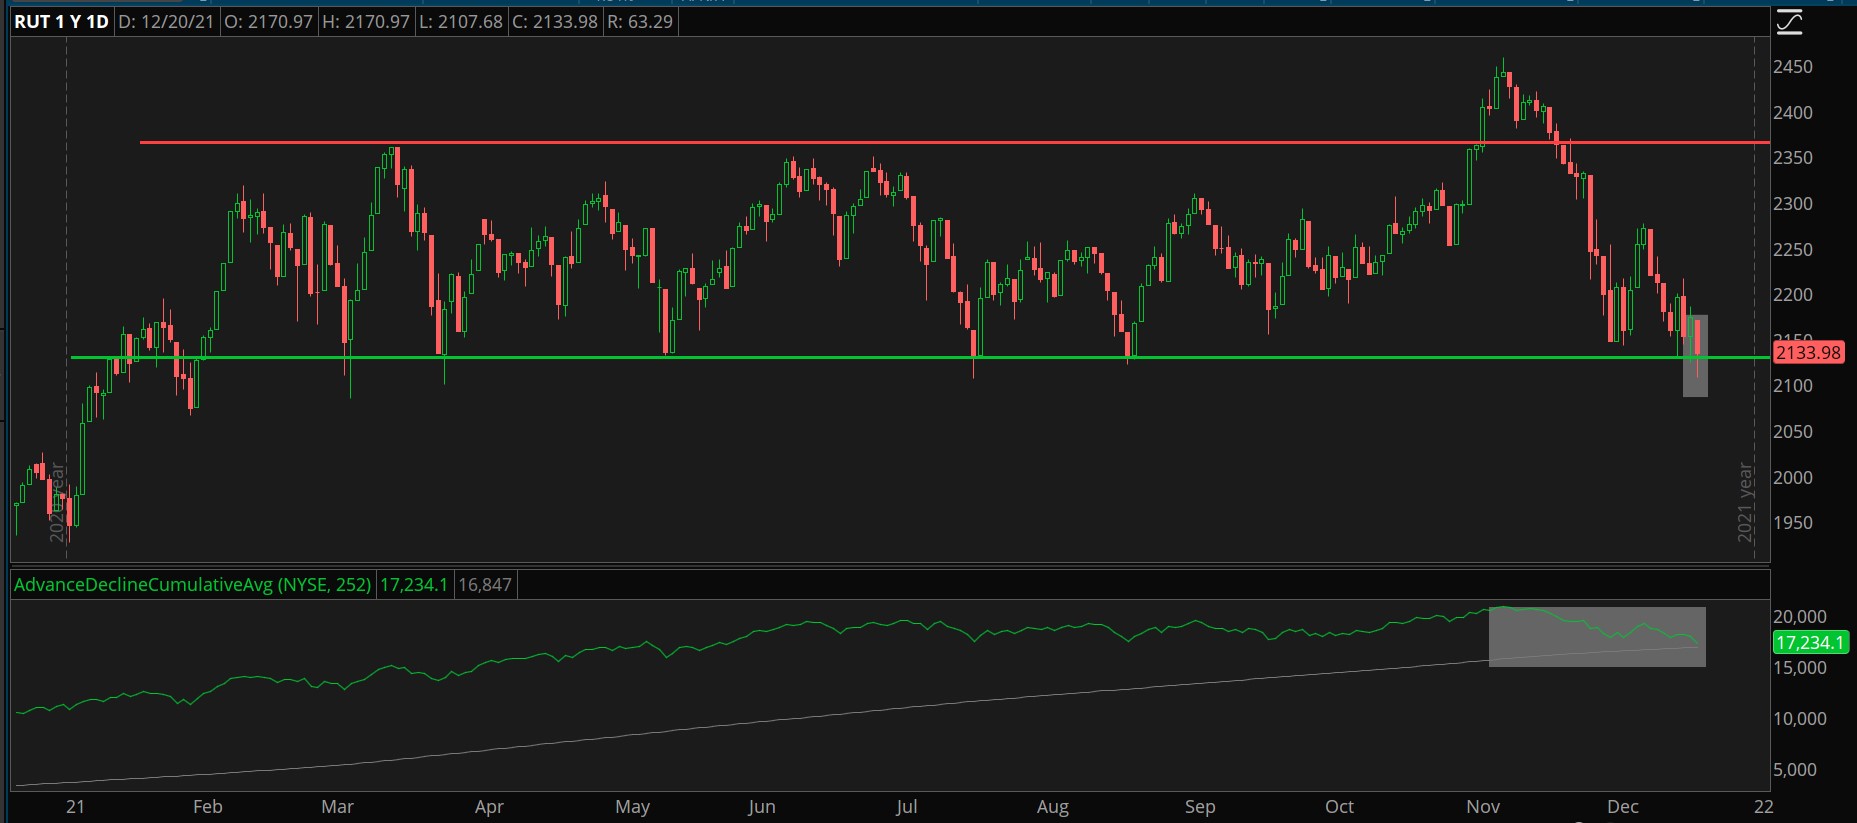
CHART OF THE DAY: HOLDING THE LINE. The Russell 2000 Index (RUT—candlesticks) tried to break support, but the bulls battled back on Monday. The NYSE Advance/Decline line (green) has recently turned down. Data Sources: ICE, S&P Dow Jones Indices. Data Sources: ICE, S&P Dow Jones Indices. Chart source: The thinkorswim® platform. For illustrative purposes only. Past performance does not guarantee future results.
Breadth of Heaven
The weakness in the Russell 2000 and a falling NYSE Advance/Decline line indicate that investors are just not very bullish on stocks right now. Instead of buying stocks that have the potential for growth, they seem to be fixed on large-cap and value stocks right now. A broader base of buying is needed if the bull market is to continue.
TD Ameritrade® commentary for educational purposes only. Member SIPC.
The preceding post was written and/or published as a collaboration between Benzinga’s in-house sponsored content team and a financial partner of Benzinga. Although the piece is not and should not be construed as editorial content, the sponsored content team works to ensure that any and all information contained within is true and accurate to the best of their knowledge and research. The content was purely for informational purposes only and not intended to be investing advice.
Image Sourced from Pixabay
© 2025 Benzinga.com. Benzinga does not provide investment advice. All rights reserved.
Trade confidently with insights and alerts from analyst ratings, free reports and breaking news that affects the stocks you care about.

