
The following post was written and/or published as a collaboration between Benzinga’s in-house sponsored content team and a financial partner of Benzinga.
EUR/USD Current price: 1.1612
- US Industrial Production fell 1.3% MoM in September, missing the market’s expectations.
- Investors are keeping an eye on US government bond yields for direction.
- EUR/USD could resume its decline once below 1.1595, the immediate support level.

The EUR/USD pair is trading near its highest for the day in the 1.1610 price zone, as the dollar weakens in the last trading session of the day. Worse-than-expected US macroeconomic figures and the better performance of Wall Street after falling European and Asian equities underpinned the pair. Nevertheless, and considering the absence of first-tier data in the Occidental world, EUR/USD remains confined to familiar levels and not far from this year’s low.
The US published September Industrial Production, which fell 1.3% MoM, while Capacity Utilization printed at 75.2%, both missing the market’s expectations. Generally speaking, the macroeconomic calendar will have nothing to offer this week, at least until Friday, when Markit will publish the preliminary estimates of its October PMIs for the EU and the US.
Meanwhile, the focus remains on US Treasury yields, the latest favourite measure of inflationary pressures. The yield on the 10-year note peaked at 1.627% but quickly retreated below the 1.60% level, adding to the dollar’s weakness at the end of the day.


EUR/USD short-term technical outlook
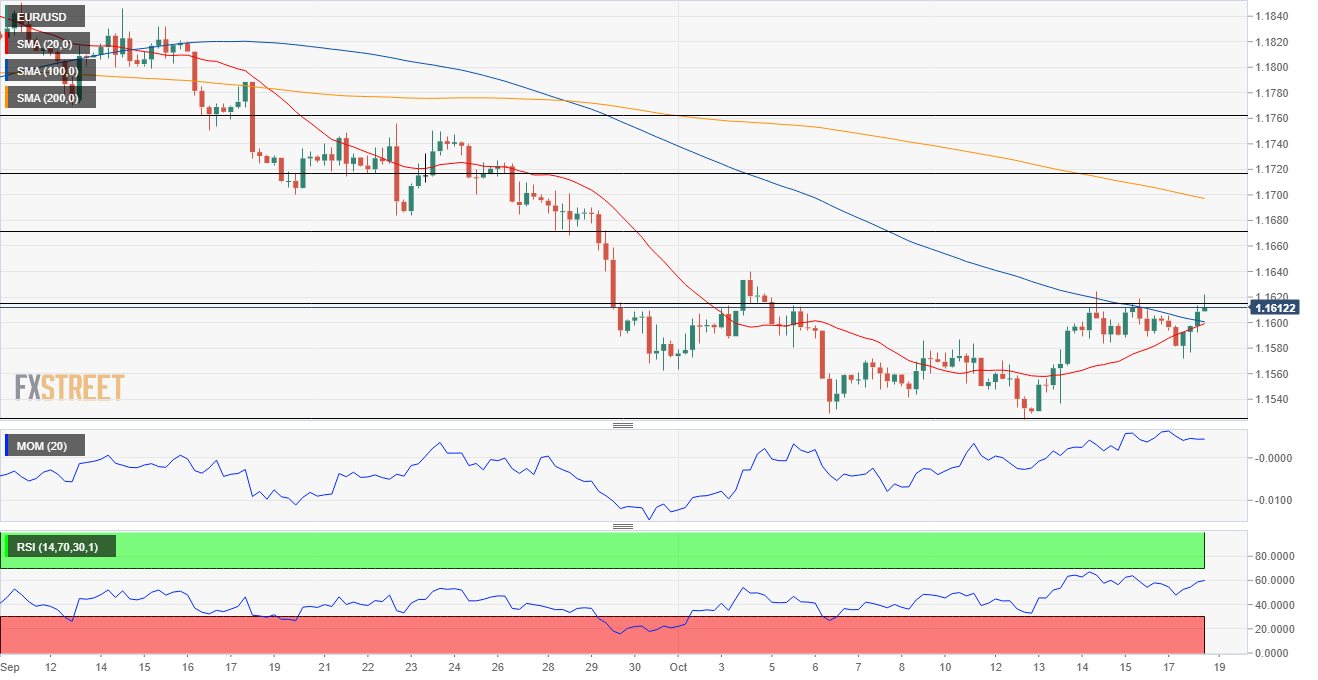
The EUR/USD pair is trading at around the 23.6% retracement of its latest daily slump, measured between 1.1908 and the year low at 1.1523. According to the daily chart, the bullish potential is still well-limited. A firmly bearish 20 SMA keeps capping the upside, while the longer moving averages maintain their bearish slopes well above the shorter one. Technical indicators are recovering some ground with uneven strength but holding within negative levels, suggesting a corrective phase instead of confirming a possible bottom.
The 4-hour chart shows that the pair is above its 20 and 100 SMAs, with the shorter one about to cross above the longer one. The Momentum indicator is flat within neutral levels, while the RSI indicator retreats from intraday highs but remains above its midline. The pair could extend its gains if it breaks above 1.1640, while bears will likely add to shorts once it breaks below 1.1595.
Support levels: 1.1595 1.1550 1.1520
Resistance levels: 1.1640 1.1685 1.1730
Image Sourced from Pixabay
The preceding post was written and/or published as a collaboration between Benzinga’s in-house sponsored content team and a financial partner of Benzinga. Although the piece is not and should not be construed as editorial content, the sponsored content team works to ensure that any and all information contained within is true and accurate to the best of their knowledge and research. This content is for informational purposes only and not intended to be investing advice.
© 2025 Benzinga.com. Benzinga does not provide investment advice. All rights reserved.
Trade confidently with insights and alerts from analyst ratings, free reports and breaking news that affects the stocks you care about.

