
Amidst the fast-paced and highly competitive business environment of today, conducting comprehensive company analysis is essential for investors and industry enthusiasts. In this article, we will delve into an extensive industry comparison, evaluating Cisco Systems CSCO in comparison to its major competitors within the Communications Equipment industry. By analyzing critical financial metrics, market position, and growth potential, our objective is to provide valuable insights for investors and offer a deeper understanding of company's performance in the industry.

Cisco Systems Background
Cisco Systems is the largest provider of networking equipment in the world and one of the largest software companies in the world. Its largest businesses are selling networking hardware and software (where it has leading market shares) and cybersecurity software like firewalls. It also has collaboration products, like its Webex suite, and observability tools. It primarily outsources its manufacturing to third parties and has a large sales and marketing staff—25,000 strong across 90 countries. Overall, Cisco employees 80,000 employees and sells its products globally.
| Company | P/E | P/B | P/S | ROE | EBITDA (in billions) | Gross Profit (in billions) | Revenue Growth |
|---|---|---|---|---|---|---|---|
| Cisco Systems Inc | 15.25 | 4.54 | 3.56 | 8.12% | $4.95 | $9.56 | 7.6% |
| Arista Networks Inc | 39.43 | 11.33 | 13.40 | 8.82% | $0.62 | $0.94 | 28.27% |
| Motorola Solutions Inc | 31.45 | 142.62 | 5.44 | 132.76% | $0.73 | $1.28 | 7.71% |
| Nokia Oyj | 4.40 | 0.79 | 0.70 | 0.66% | $0.51 | $1.93 | -20.17% |
| F5 Inc | 27.44 | 3.83 | 3.85 | 5.58% | $0.2 | $0.57 | 0.99% |
| Juniper Networks Inc | 26.35 | 2.17 | 1.71 | 1.75% | $0.15 | $0.81 | -1.19% |
| Ciena Corp | 26.37 | 2.29 | 1.54 | 3.15% | $0.13 | $0.49 | 16.32% |
| Calix Inc | 62.73 | 3.85 | 3 | 2.27% | $0.02 | $0.14 | 11.64% |
| Extreme Networks Inc | 25.61 | 21.42 | 1.75 | 25.46% | $0.04 | $0.21 | 18.63% |
| Viavi Solutions Inc | 1006 | 3.31 | 2.17 | 1.43% | $0.04 | $0.14 | -20.08% |
| NetScout Systems Inc | 24.08 | 0.77 | 1.82 | 1.05% | $0.05 | $0.15 | -13.71% |
| Harmonic Inc | 252.06 | 4.26 | 2.51 | -1.9% | $-0.01 | $0.06 | -18.32% |
| Digi International Inc | 40.04 | 1.80 | 2.22 | 1.19% | $0.02 | $0.06 | 6.08% |
| Clearfield Inc | 13.66 | 1.43 | 1.66 | 0.86% | $0.01 | $0.01 | -47.72% |
| Aviat Networks Inc | 21.17 | 1.82 | 1.13 | 1.8% | $0.01 | $0.03 | 7.77% |
| Average | 114.34 | 14.41 | 3.06 | 13.21% | $0.18 | $0.49 | -1.7% |
By analyzing Cisco Systems, we can infer the following trends:
-
The Price to Earnings ratio of 15.25 is 0.13x lower than the industry average, indicating potential undervaluation for the stock.
-
The current Price to Book ratio of 4.54, which is 0.32x the industry average, is substantially lower than the industry average, indicating potential undervaluation.
-
The Price to Sales ratio of 3.56, which is 1.16x the industry average, suggests the stock could potentially be overvalued in relation to its sales performance compared to its peers.
-
The company has a lower Return on Equity (ROE) of 8.12%, which is 5.09% below the industry average. This indicates potential inefficiency in utilizing equity to generate profits, which could be attributed to various factors.
-
The Earnings Before Interest, Taxes, Depreciation, and Amortization (EBITDA) of $4.95 Billion is 27.5x above the industry average, highlighting stronger profitability and robust cash flow generation.
-
The gross profit of $9.56 Billion is 19.51x above that of its industry, highlighting stronger profitability and higher earnings from its core operations.
-
The company's revenue growth of 7.6% exceeds the industry average of -1.7%, indicating strong sales performance and market outperformance.
Debt To Equity Ratio

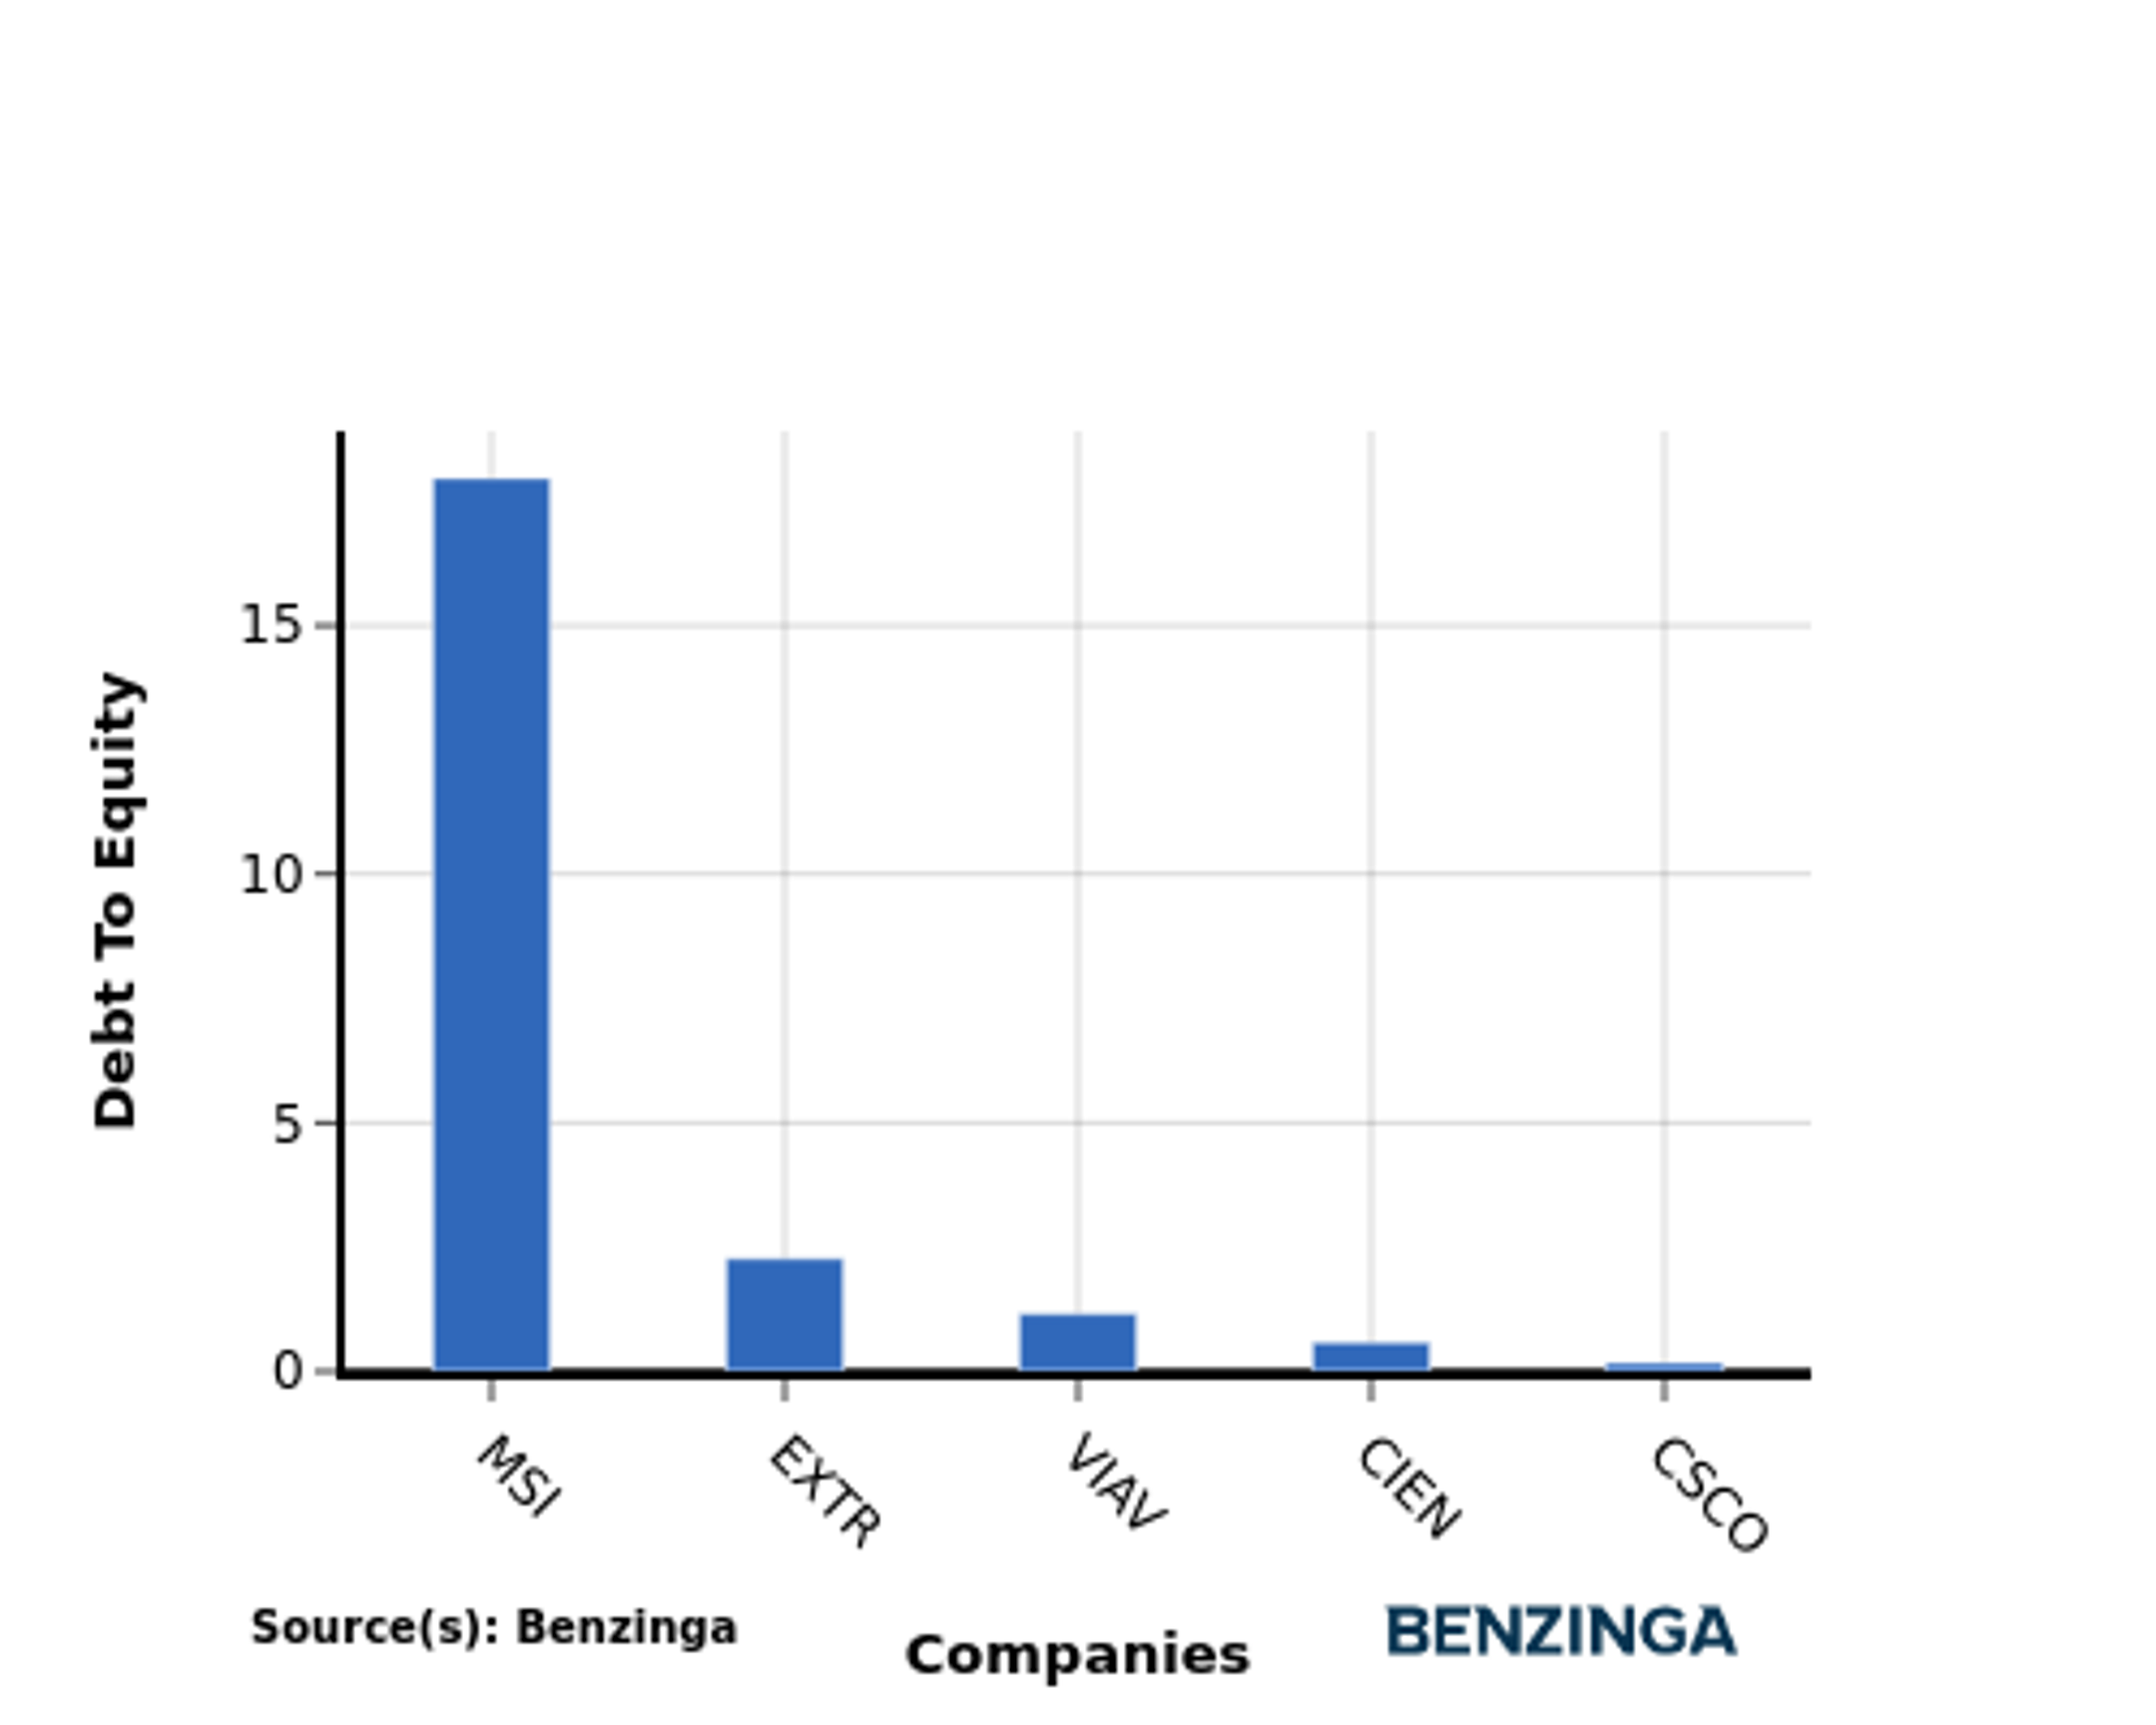
The debt-to-equity (D/E) ratio assesses the extent to which a company relies on borrowed funds compared to its equity.
Considering the debt-to-equity ratio in industry comparisons allows for a concise evaluation of a company's financial health and risk profile, aiding in informed decision-making.
When examining Cisco Systems in comparison to its top 4 peers with respect to the Debt-to-Equity ratio, the following information becomes apparent:
-
Compared to its top 4 peers, Cisco Systems has a stronger financial position indicated by its lower debt-to-equity ratio of 0.17.
-
This suggests that the company relies less on debt financing and has a more favorable balance between debt and equity, which can be seen as a positive attribute by investors.
Key Takeaways
The valuation analysis of Cisco Systems in the Communications Equipment industry reveals that the company has a low PE ratio, indicating that its stock is undervalued compared to its peers. The low PB ratio suggests that Cisco Systems is trading at a lower price relative to its book value. However, the high PS ratio implies that the company's stock is relatively expensive compared to its revenue. In terms of profitability, Cisco Systems has a low ROE, indicating lower returns on shareholder equity. On the other hand, the company exhibits high EBITDA, gross profit, and revenue growth, suggesting strong financial performance.
This article was generated by Benzinga's automated content engine and reviewed by an editor.
Edge Rankings
Price Trend
© 2025 Benzinga.com. Benzinga does not provide investment advice. All rights reserved.
Trade confidently with insights and alerts from analyst ratings, free reports and breaking news that affects the stocks you care about.

