


Amidst the fast-paced and highly competitive business environment of today, conducting comprehensive company analysis is essential for investors and industry enthusiasts. In this article, we will delve into an extensive industry comparison, evaluating Palantir Technologies PLTR in comparison to its major competitors within the Software industry. By analyzing critical financial metrics, market position, and growth potential, our objective is to provide valuable insights for investors and offer a deeper understanding of company's performance in the industry.


Palantir Technologies Background
Palantir is an analytical software company that focuses on leveraging data to create efficiencies in its clients' organizations. The firm serves commercial and government clients via its Foundry and Gotham platforms, respectively. The Denver-based company was founded in 2003 and went public in 2020.
| Company | P/E | P/B | P/S | ROE | EBITDA (in billions) | Gross Profit (in billions) | Revenue Growth |
|---|---|---|---|---|---|---|---|
| Palantir Technologies Inc | 246 | 11.75 | 18.10 | 2.33% | $0.09 | $0.45 | 16.8% |
| Adobe Inc | 54.72 | 17.56 | 14.84 | 9.17% | $1.99 | $4.31 | 10.31% |
| Salesforce Inc | 94.62 | 4.15 | 7.22 | 2.11% | $2.42 | $6.57 | 11.27% |
| SAP SE | 80.87 | 4.03 | 5.42 | 3.01% | $2.37 | $5.64 | 3.57% |
| Intuit Inc | 62.59 | 9.42 | 10.96 | 1.41% | $0.53 | $2.22 | 14.67% |
| Synopsys Inc | 67.40 | 13.20 | 14.18 | 5.77% | $0.5 | $1.27 | 7.52% |
| Workday Inc | 1134.88 | 10.81 | 10.23 | 1.76% | $0.23 | $1.42 | 16.67% |
| Cadence Design Systems Inc | 73.92 | 22.67 | 18.06 | 8.45% | $0.35 | $0.91 | 13.36% |
| Roper Technologies Inc | 46.30 | 3.35 | 9.56 | 2.06% | $0.68 | $1.1 | 15.78% |
| Autodesk Inc | 52.80 | 32.32 | 9.07 | 17.93% | $0.37 | $1.29 | 10.47% |
| Splunk Inc | 218.84 | 127.96 | 6.29 | 121.15% | $0.14 | $0.86 | 14.8% |
| Ansys Inc | 51.74 | 4.96 | 11.58 | 1.12% | $0.11 | $0.39 | -2.9% |
| Zoom Video Communications Inc | 94.64 | 2.95 | 4.88 | 1.96% | $0.2 | $0.87 | 3.16% |
| PTC Inc | 79.23 | 7.27 | 9.29 | 1.73% | $0.16 | $0.43 | 7.62% |
| Tyler Technologies Inc | 108.69 | 5.94 | 8.92 | 1.67% | $0.11 | $0.23 | 4.54% |
| Dynatrace Inc | 93 | 8.81 | 12.28 | 2.04% | $0.05 | $0.29 | 25.91% |
| Bentley Systems Inc | 92.06 | 21.67 | 13.95 | 7.94% | $0.1 | $0.24 | 14.27% |
| Manhattan Associates Inc | 84.01 | 65.23 | 15.70 | 25.97% | $0.05 | $0.13 | 20.36% |
| NICE Ltd | 40.78 | 3.96 | 5.75 | 2.89% | $0.16 | $0.41 | 8.4% |
| AppLovin Corp | 131.54 | 11.29 | 4.48 | 8.25% | $0.31 | $0.6 | 21.2% |
| Average | 140.14 | 19.87 | 10.14 | 11.92% | $0.57 | $1.54 | 11.63% |
When closely examining Palantir Technologies, the following trends emerge:
-
The Price to Earnings ratio of 246.0 for this company is 1.76x above the industry average, indicating a premium valuation associated with the stock.
-
The current Price to Book ratio of 11.75, which is 0.59x the industry average, is substantially lower than the industry average, indicating potential undervaluation.
-
The Price to Sales ratio of 18.1, which is 1.79x the industry average, suggests the stock could potentially be overvalued in relation to its sales performance compared to its peers.
-
With a Return on Equity (ROE) of 2.33% that is 9.59% below the industry average, it appears that the company exhibits potential inefficiency in utilizing equity to generate profits.
-
The Earnings Before Interest, Taxes, Depreciation, and Amortization (EBITDA) of $90 Million is 0.16x below the industry average, suggesting potential lower profitability or financial challenges.
-
Compared to its industry, the company has lower gross profit of $450 Million, which indicates 0.29x below the industry average, potentially indicating lower revenue after accounting for production costs.
-
With a revenue growth of 16.8%, which surpasses the industry average of 11.63%, the company is demonstrating robust sales expansion and gaining market share.
Debt To Equity Ratio

The debt-to-equity (D/E) ratio gauges the extent to which a company has financed its operations through debt relative to equity.
Considering the debt-to-equity ratio in industry comparisons allows for a concise evaluation of a company's financial health and risk profile, aiding in informed decision-making.
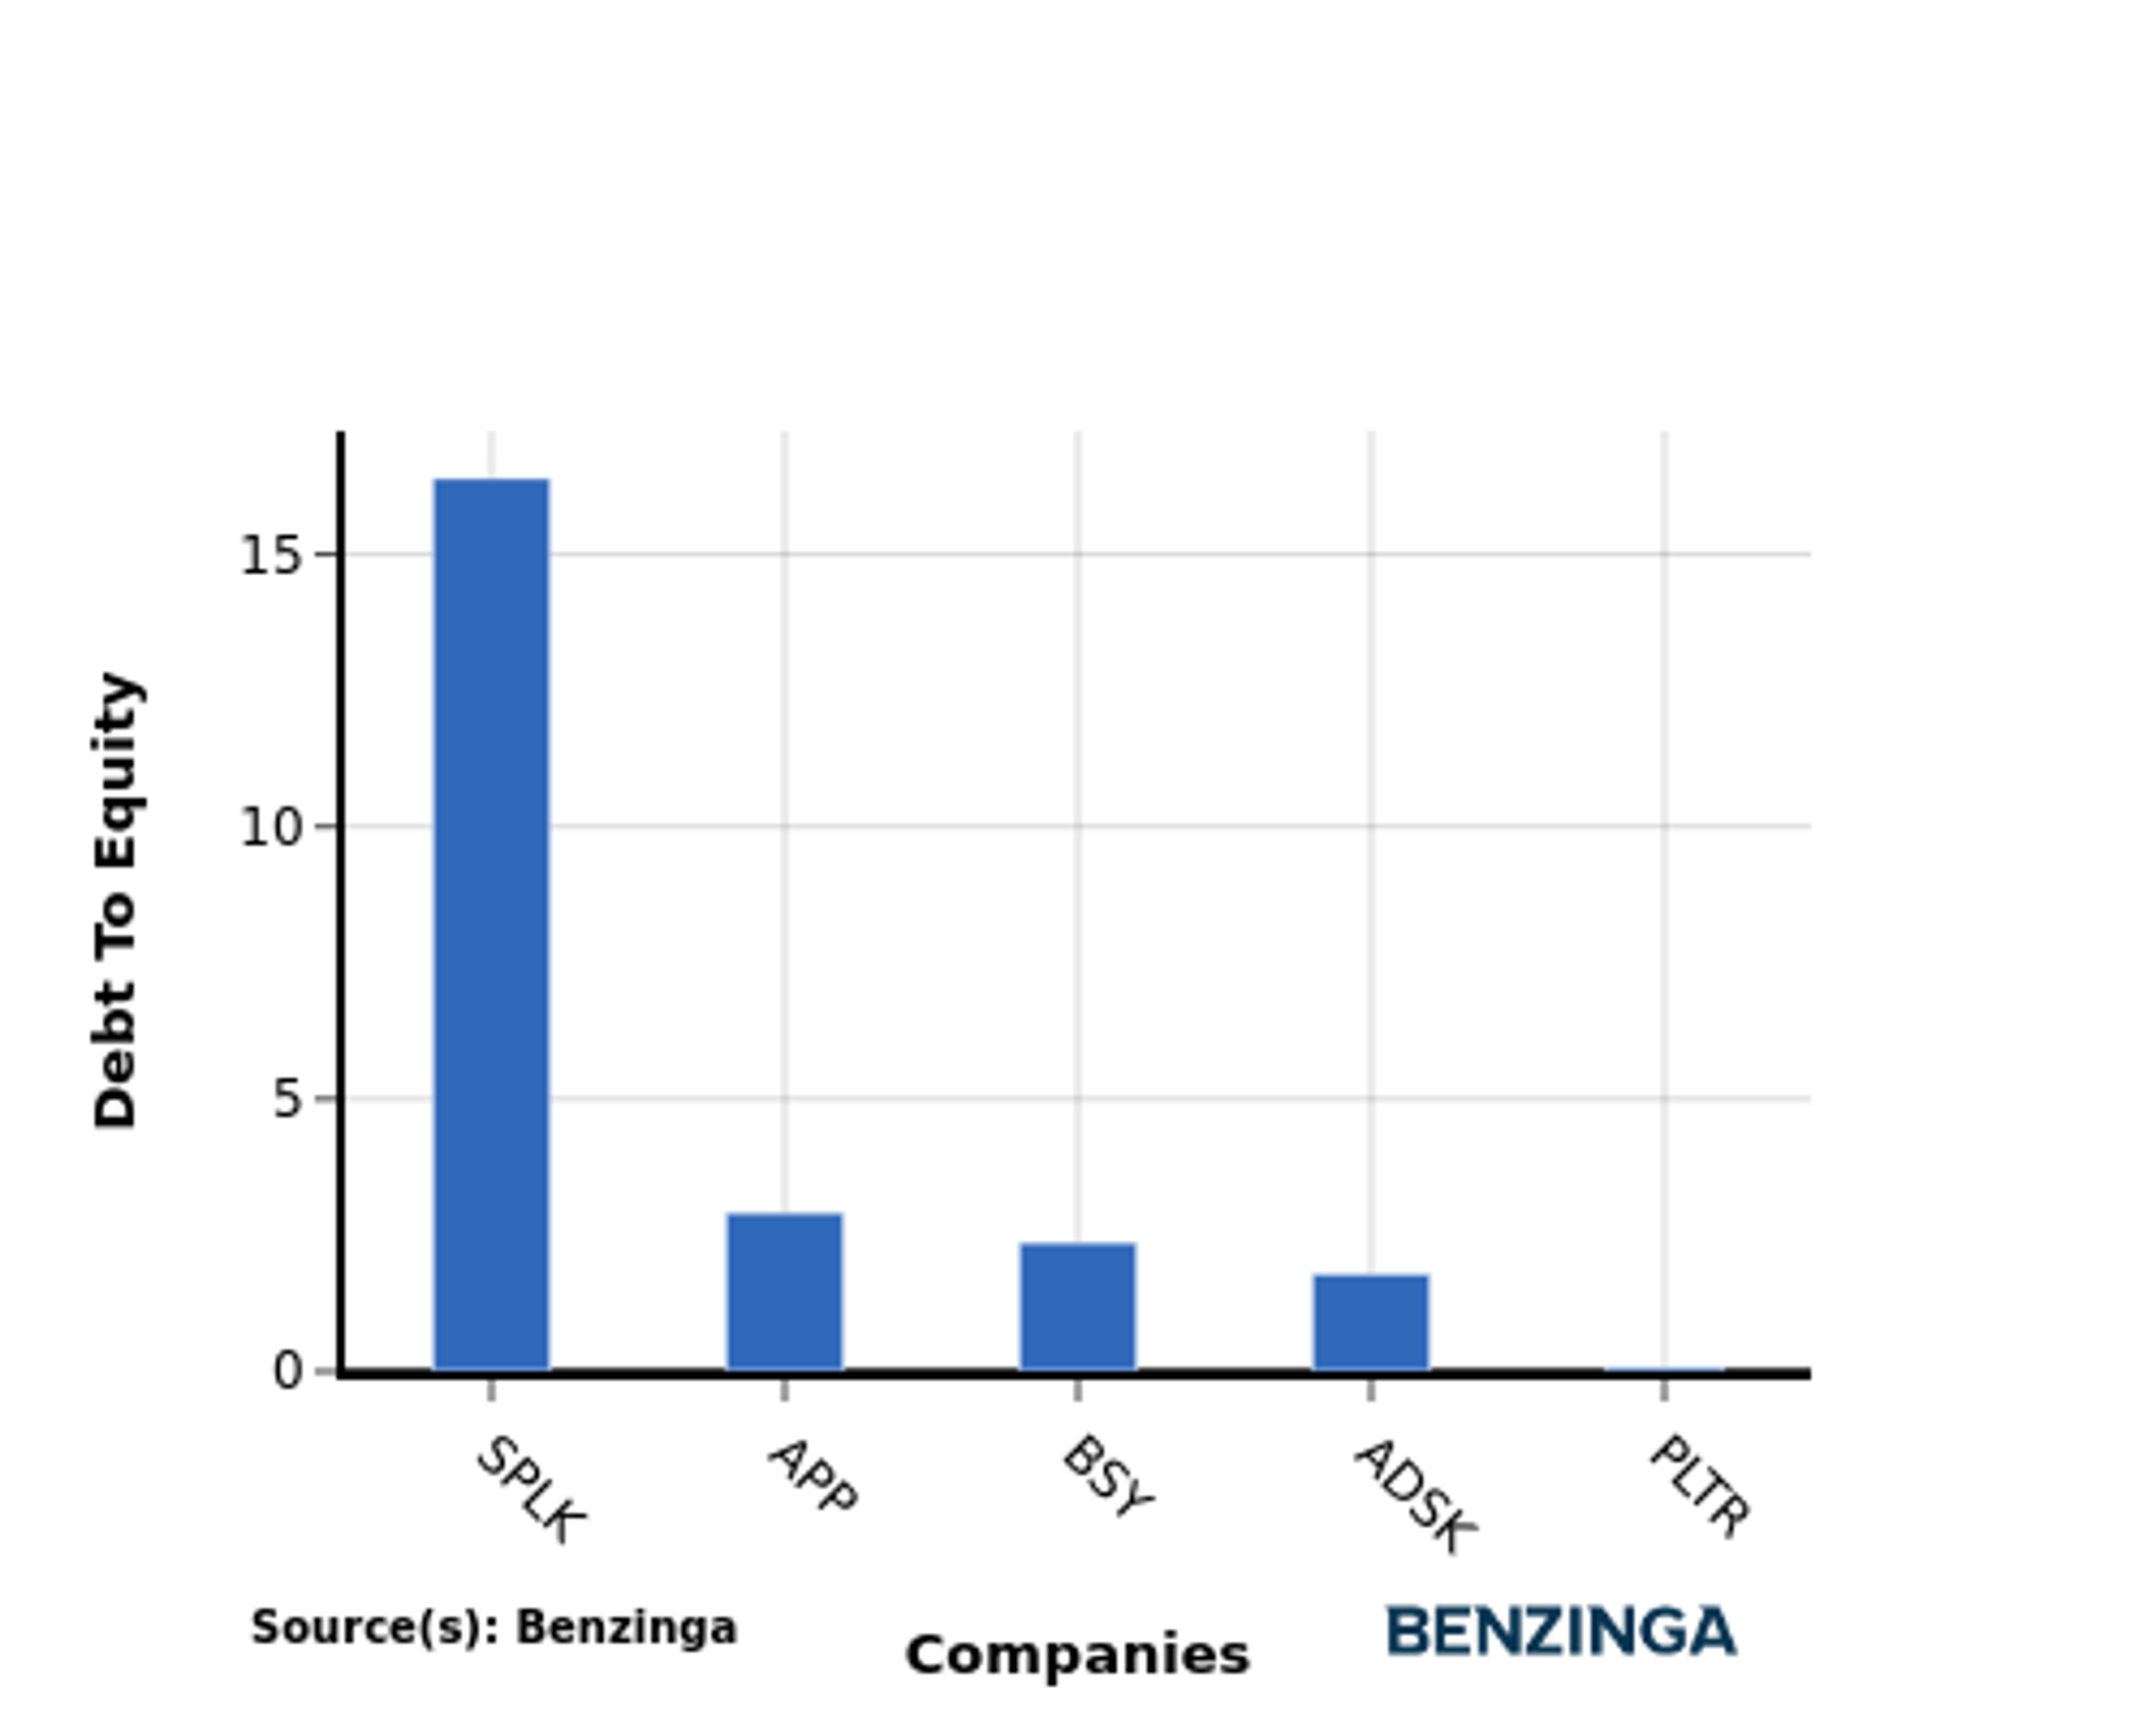
When examining Palantir Technologies in comparison to its top 4 peers with respect to the Debt-to-Equity ratio, the following information becomes apparent:
-
Compared to its top 4 peers, Palantir Technologies has a stronger financial position indicated by its lower debt-to-equity ratio of 0.07.
-
This suggests that the company relies less on debt financing and has a more favorable balance between debt and equity, which can be seen as a positive attribute by investors.
Key Takeaways
The PE, PB, and PS ratios for Palantir Technologies indicate that the company's stock price is relatively high compared to its earnings, book value, and sales. This suggests that investors may be paying a premium for the company's future growth potential. On the other hand, the low ROE, EBITDA, gross profit, and revenue growth ratios indicate that Palantir Technologies may be underperforming compared to its peers in the software industry. This could be a cause for concern for investors looking for companies with strong financial performance.
This article was generated by Benzinga's automated content engine and reviewed by an editor.
Edge Rankings
Price Trend
© 2025 Benzinga.com. Benzinga does not provide investment advice. All rights reserved.
Trade confidently with insights and alerts from analyst ratings, free reports and breaking news that affects the stocks you care about.

