
In the dynamic and fiercely competitive business environment, conducting a thorough analysis of companies is crucial for investors and industry enthusiasts. In this article, we will perform an extensive industry comparison, evaluating Charter Communications CHTR in relation to its major competitors in the Media industry. By closely examining crucial financial metrics, market position, and growth prospects, we aim to offer valuable insights for investors and shed light on company's performance within the industry.

Charter Communications Background
Charter is the product of the 2016 merger of three cable companies, each with a decades-long history in the business: Legacy Charter, Time Warner Cable, and Bright House Networks. The firm now holds networks capable of providing television, internet access, and phone services to roughly 56 million U.S. homes and businesses, around 40% of the country. Across this footprint, Charter serves 30 million residential and 2 million commercial customer accounts under the Spectrum brand, making it the second-largest U.S. cable company behind Comcast. The firm also owns, in whole or in part, sports and news networks, including Spectrum SportsNet (long-term local rights to Los Angeles Lakers games), SportsNet LA (Los Angeles Dodgers), SportsNet New York (New York Mets), and Spectrum News NY1.
| Company | P/E | P/B | P/S | ROE | EBITDA (in billions) | Gross Profit (in billions) | Revenue Growth |
|---|---|---|---|---|---|---|---|
| Charter Communications Inc | 14.43 | 6.15 | 1.22 | 12.31% | $5.33 | $6.25 | 0.45% |
| Comcast Corp | 26.94 | 2.10 | 1.52 | 5.1% | $10.26 | $21.66 | 1.66% |
| Cable One Inc | 32.50 | 1.96 | 2.24 | 3.15% | $0.22 | $0.31 | -1.18% |
| DISH Network Corp | 1.80 | 0.14 | 0.20 | 1.09% | $0.57 | $1.12 | -7.09% |
| Average | 20.41 | 1.4 | 1.32 | 3.11% | $3.68 | $7.7 | -2.2% |
Through a meticulous analysis of Charter Communications, we can observe the following trends:
-
With a Price to Earnings ratio of 14.43, which is 0.71x less than the industry average, the stock shows potential for growth at a reasonable price, making it an interesting consideration for market participants.
-
With a Price to Book ratio of 6.15, which is 4.39x the industry average, Charter Communications might be considered overvalued in terms of its book value, as it is trading at a higher multiple compared to its industry peers.
-
The Price to Sales ratio is 1.22, which is 0.92x the industry average. This suggests a possible undervaluation based on sales performance.
-
The company has a higher Return on Equity (ROE) of 12.31%, which is 9.2% above the industry average. This suggests efficient use of equity to generate profits and demonstrates profitability and growth potential.
-
The company exhibits higher Earnings Before Interest, Taxes, Depreciation, and Amortization (EBITDA) of $5.33 Billion, which is 1.45x above the industry average, implying stronger profitability and robust cash flow generation.
-
The gross profit of $6.25 Billion is 0.81x below that of its industry, suggesting potential lower revenue after accounting for production costs.
-
The company is experiencing remarkable revenue growth, with a rate of 0.45%, outperforming the industry average of -2.2%.
Debt To Equity Ratio

The debt-to-equity (D/E) ratio is an important measure to assess the financial structure and risk profile of a company.
Considering the debt-to-equity ratio in industry comparisons allows for a concise evaluation of a company's financial health and risk profile, aiding in informed decision-making.
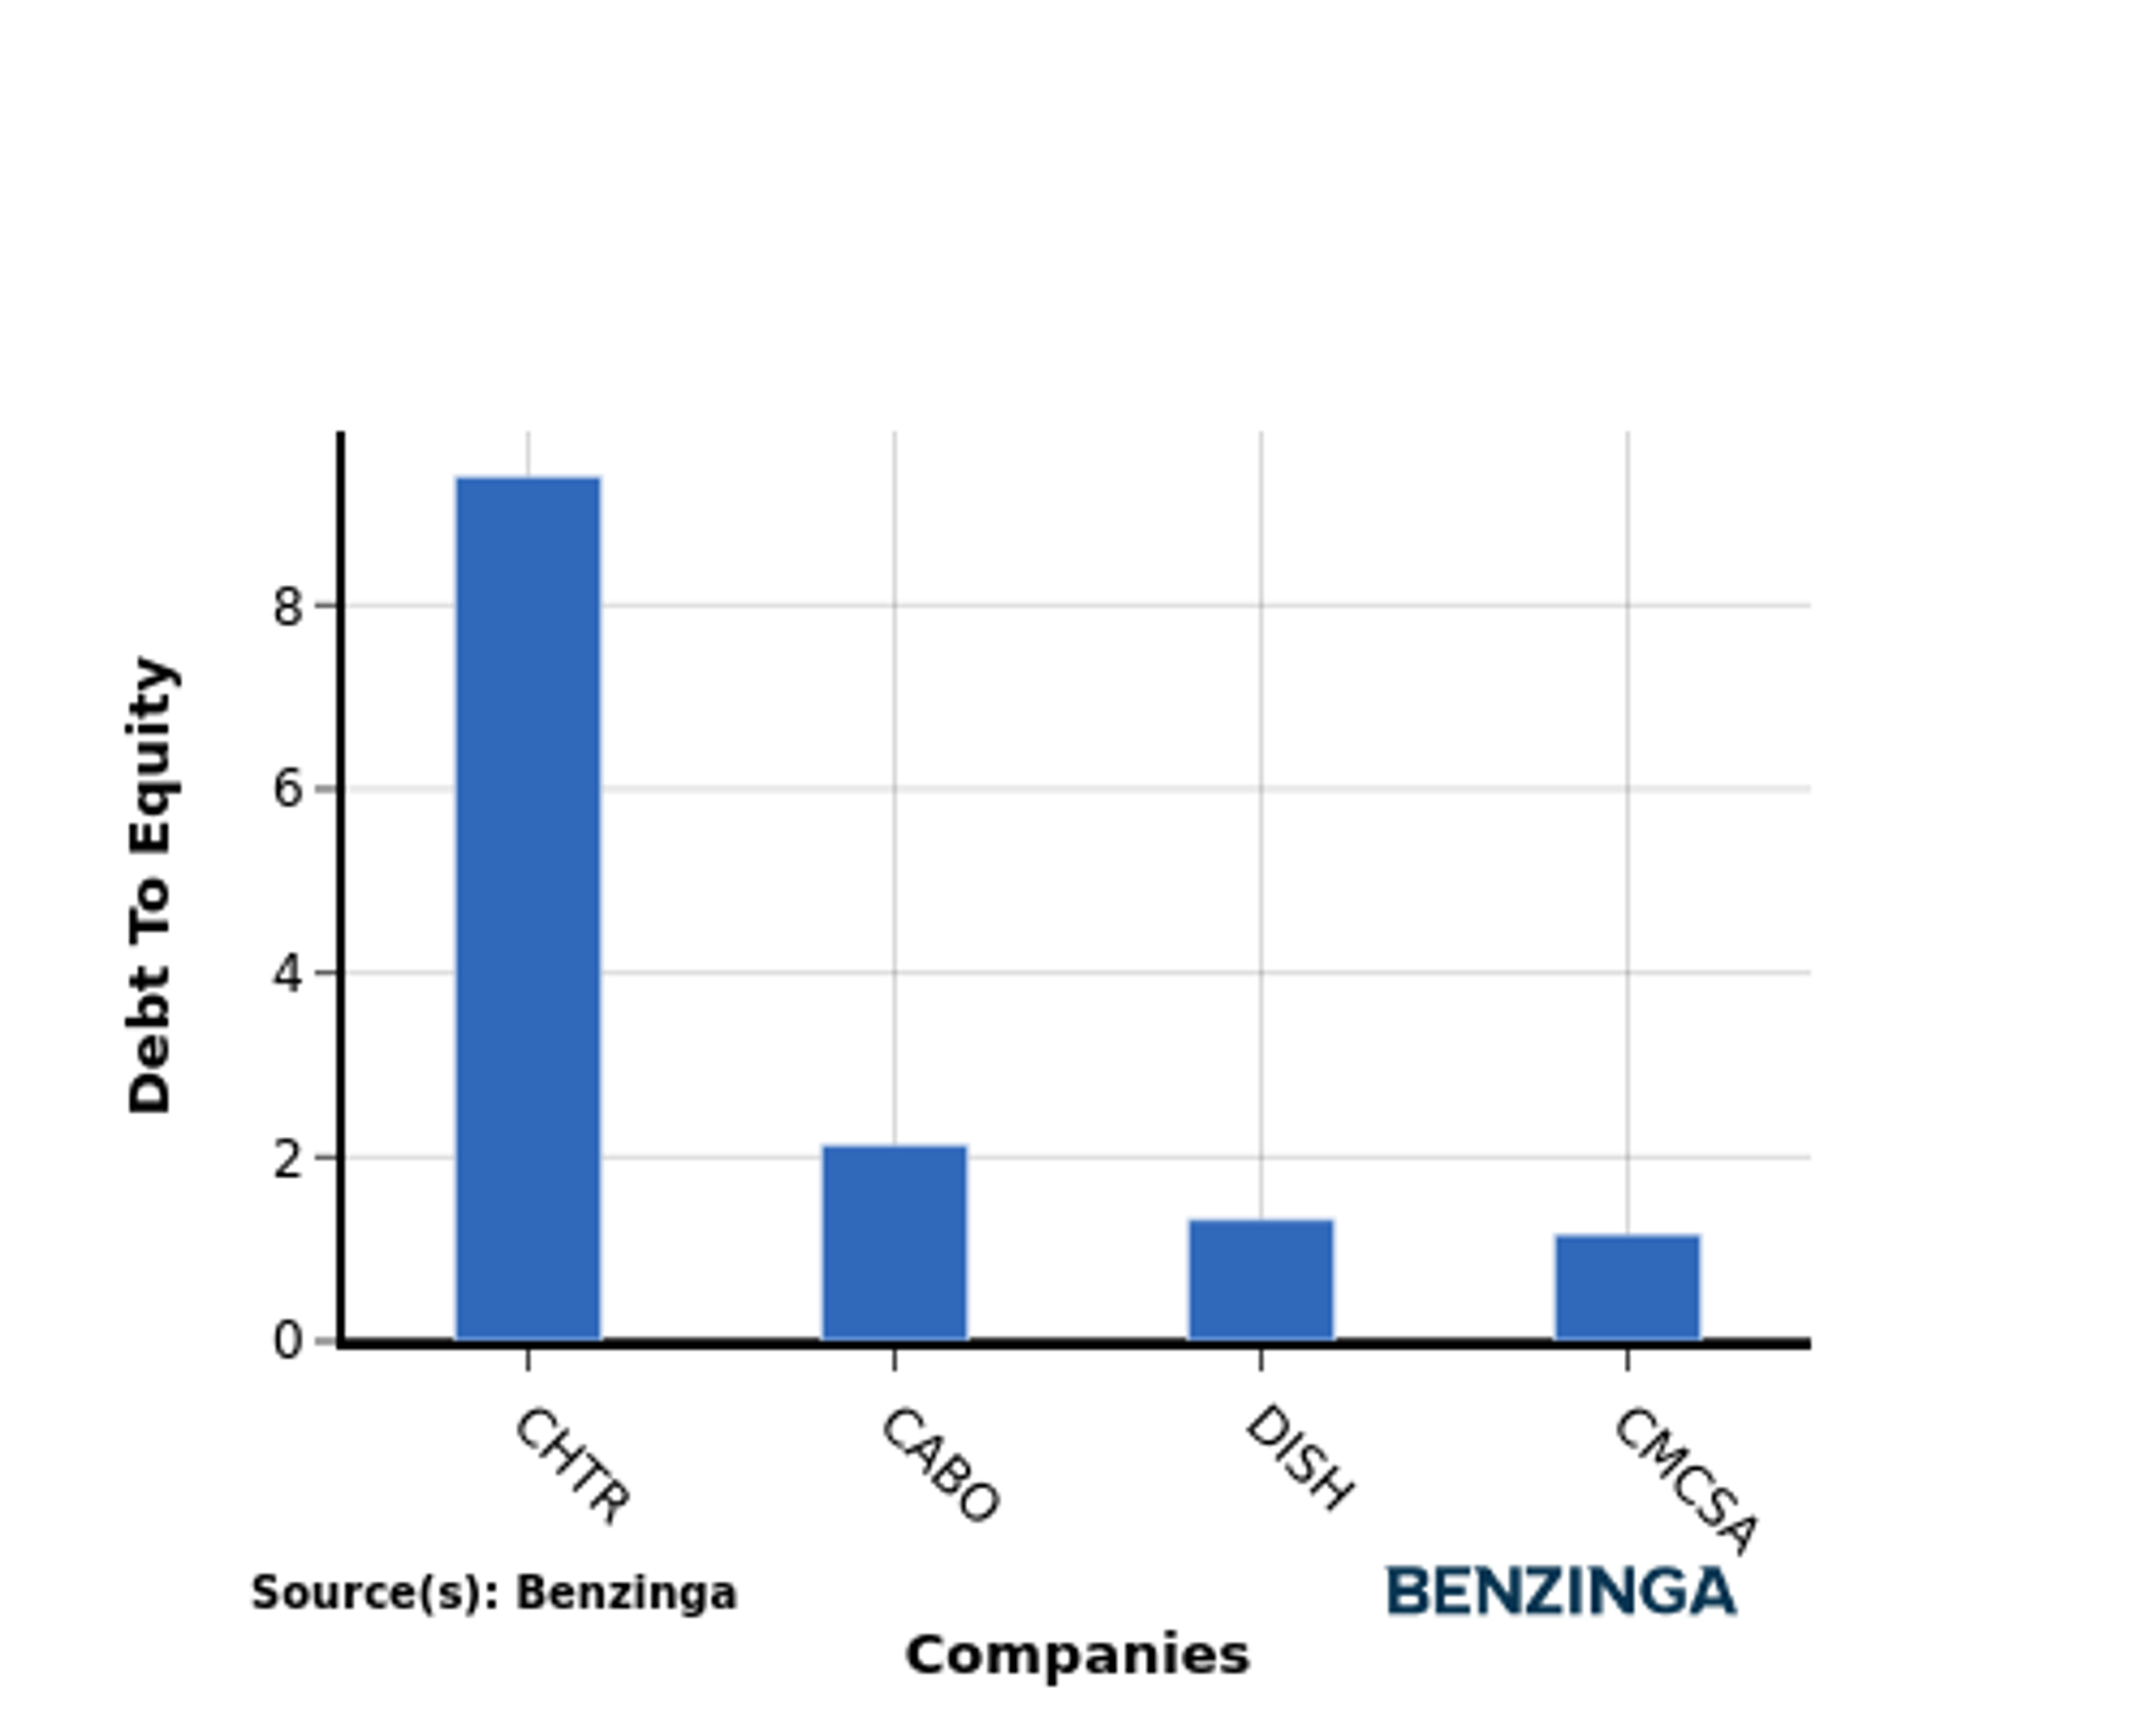
In light of the Debt-to-Equity ratio, a comparison between Charter Communications and its top 4 peers reveals the following information:
-
Charter Communications has a higher debt-to-equity ratio of 9.39 compared to its top 4 peers.
-
This indicates a higher level of financial risk as the company relies more heavily on borrowed funds. Investors may perceive this as a potential concern.
Key Takeaways
Charter Communications has a low PE ratio compared to its peers in the Media industry, indicating that the stock may be undervalued. The company also has a high PB ratio, suggesting that investors are willing to pay a premium for its book value. Additionally, Charter Communications has a low PS ratio, indicating that the stock is trading at a lower price relative to its sales. On the other hand, the company has a high ROE, EBITDA, and revenue growth, suggesting strong profitability and growth potential compared to its industry peers. However, the company's gross profit is relatively low, which may indicate lower profitability compared to its competitors.
This article was generated by Benzinga's automated content engine and reviewed by an editor.
Edge Rankings
Price Trend
© 2025 Benzinga.com. Benzinga does not provide investment advice. All rights reserved.
Trade confidently with insights and alerts from analyst ratings, free reports and breaking news that affects the stocks you care about.

