
In the current session, the stock is trading at $131.25, after a 2.41% spike. Over the past month, Airbnb Inc. ABNB stock increased by 11.36%, and in the past year, by 38.01%. With performance like this, long-term shareholders are optimistic but others are more likely to look into the price-to-earnings ratio to see if the stock might be overvalued.


Evaluating Airbnb P/E in Comparison to Its Peers
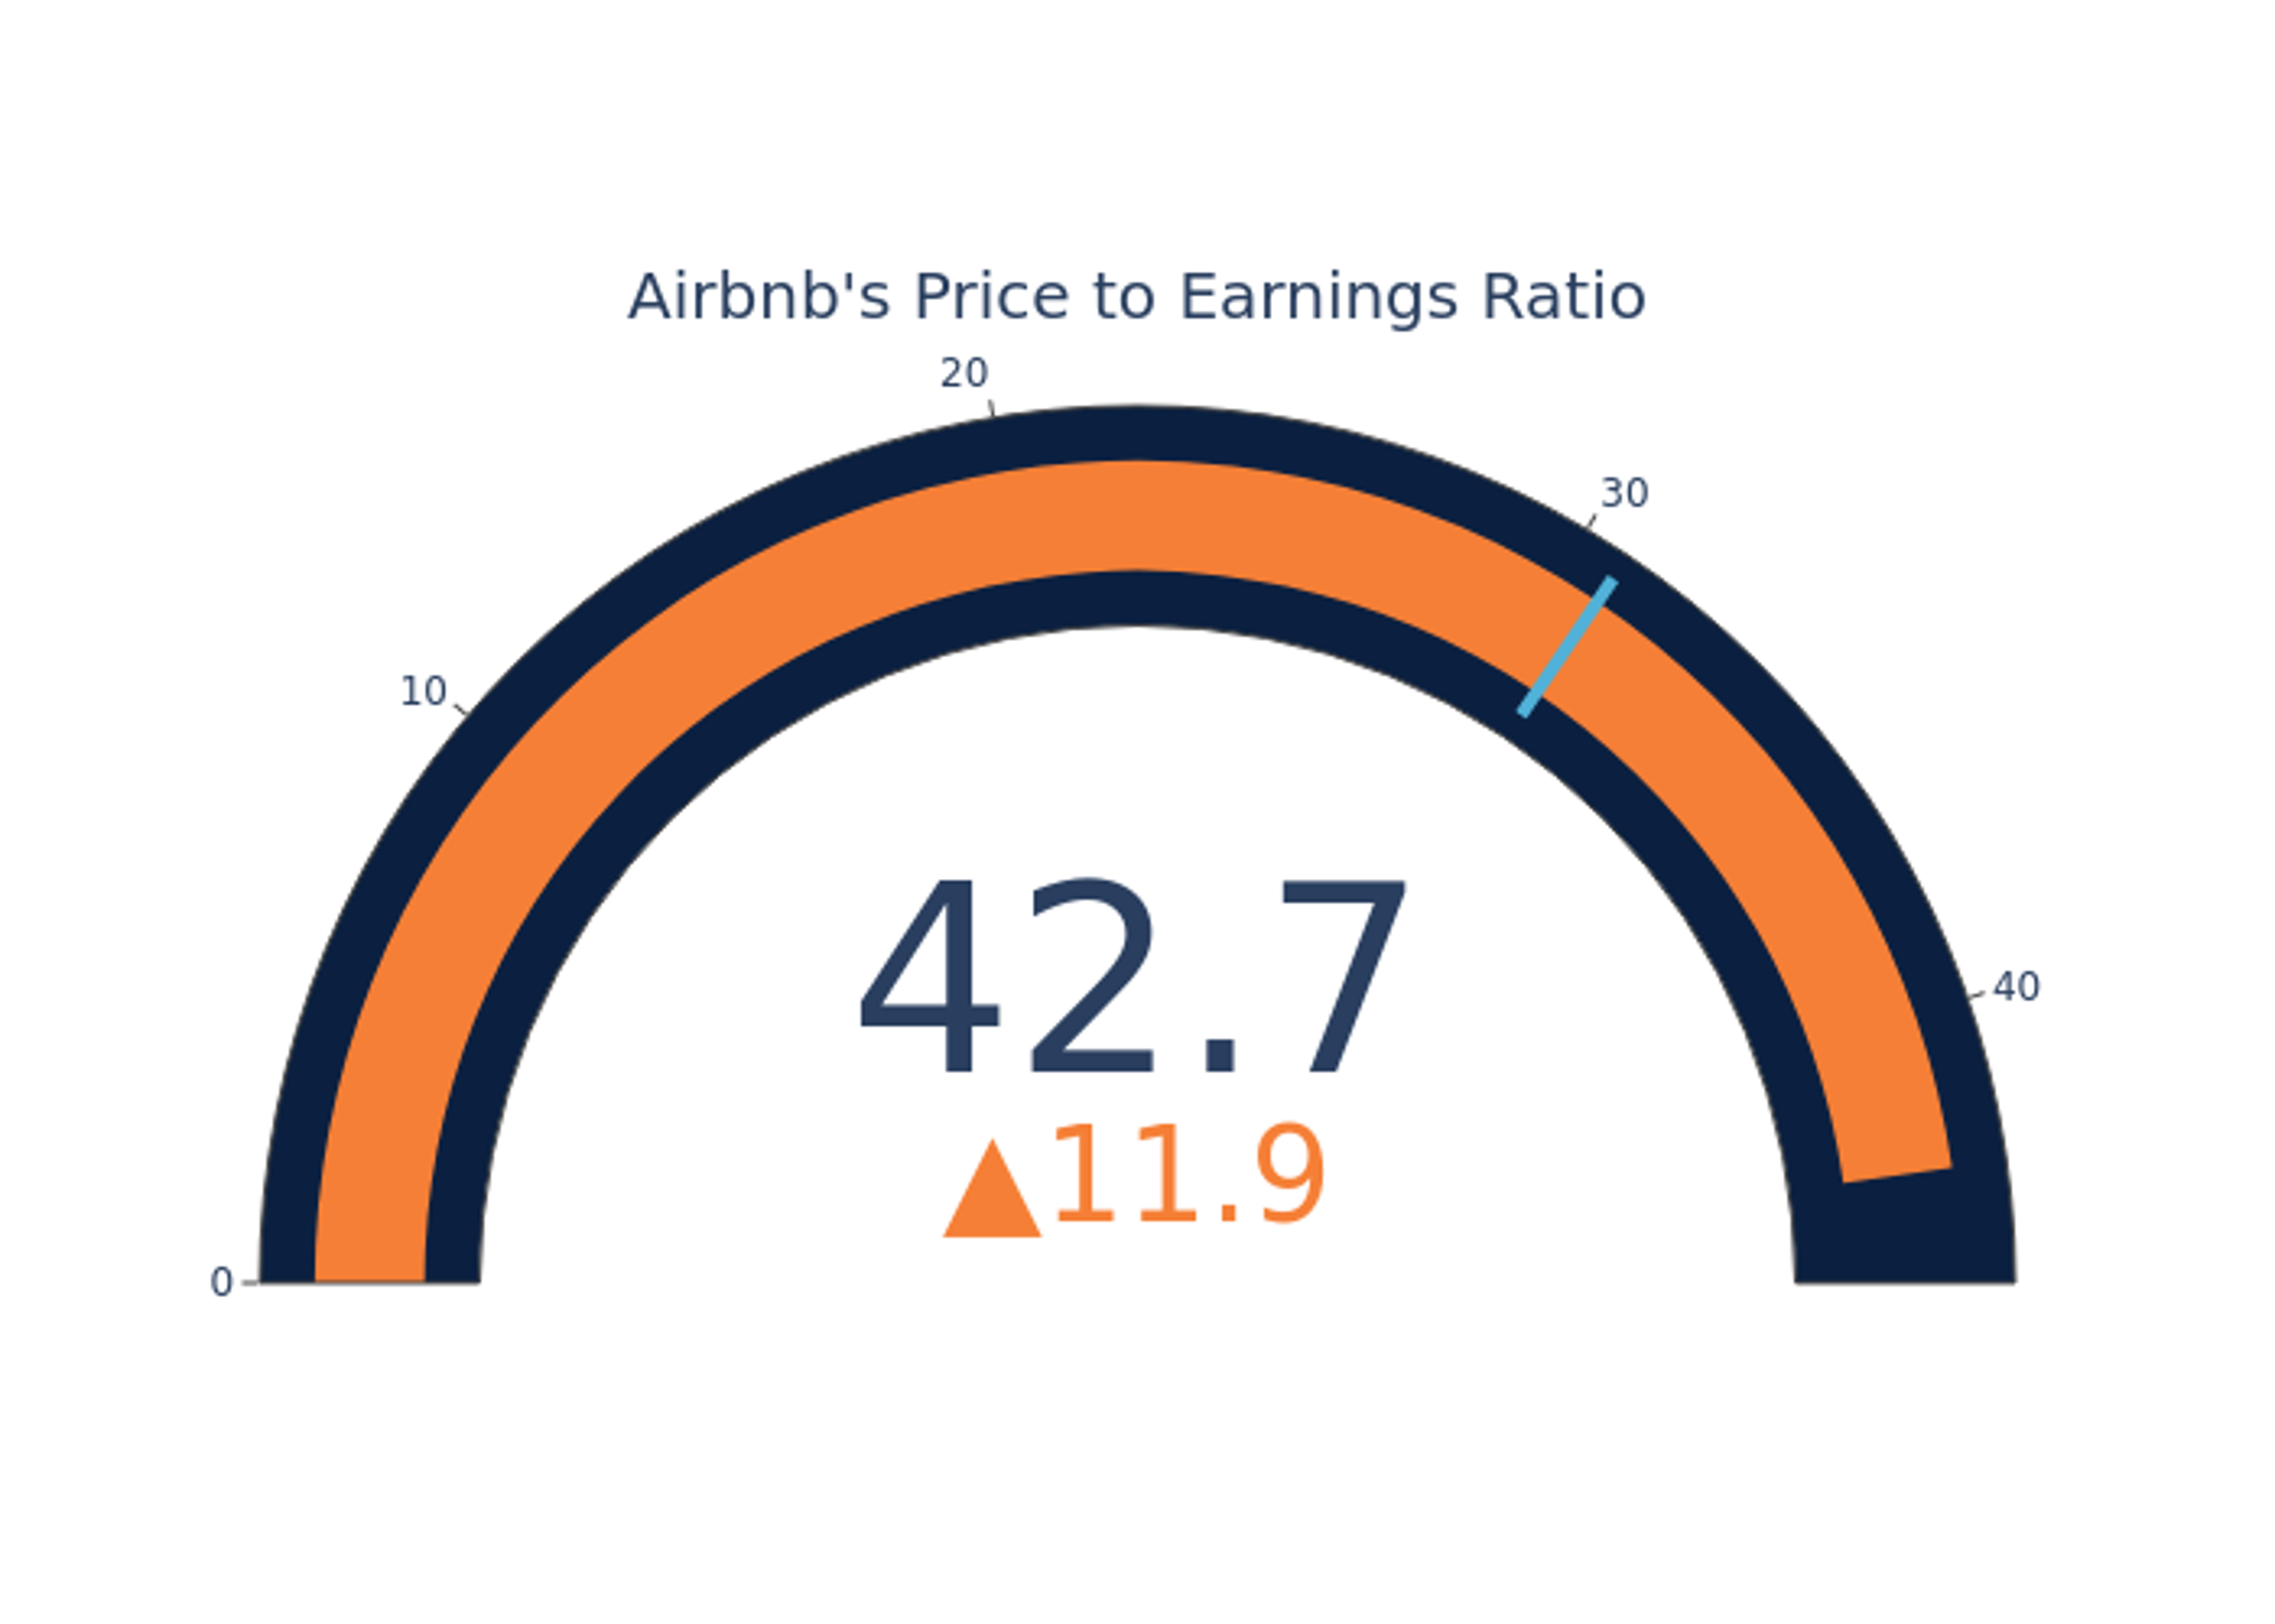
The P/E ratio measures the current share price to the company's EPS. It is used by long-term investors to analyze the company's current performance against it's past earnings, historical data and aggregate market data for the industry or the indices, such as S&P 500. A higher P/E indicates that investors expect the company to perform better in the future, and the stock is probably overvalued, but not necessarily. It also could indicate that investors are willing to pay a higher share price currently, because they expect the company to perform better in the upcoming quarters. This leads investors to also remain optimistic about rising dividends in the future.
Airbnb has a better P/E ratio of 42.72 than the aggregate P/E ratio of 30.8 of the Hotels, Restaurants & Leisure industry. Ideally, one might believe that Airbnb Inc. might perform better in the future than it's industry group, but it's probable that the stock is overvalued.

In conclusion, the price-to-earnings ratio is a useful metric for analyzing a company's market performance, but it has its limitations. While a lower P/E can indicate that a company is undervalued, it can also suggest that shareholders do not expect future growth. Additionally, the P/E ratio should not be used in isolation, as other factors such as industry trends and business cycles can also impact a company's stock price. Therefore, investors should use the P/E ratio in conjunction with other financial metrics and qualitative analysis to make informed investment decisions.
Edge Rankings
Price Trend
© 2025 Benzinga.com. Benzinga does not provide investment advice. All rights reserved.
Trade confidently with insights and alerts from analyst ratings, free reports and breaking news that affects the stocks you care about.

