
The following post was written and/or published as a collaboration between Benzinga’s in-house sponsored content team and a financial partner of Benzinga.
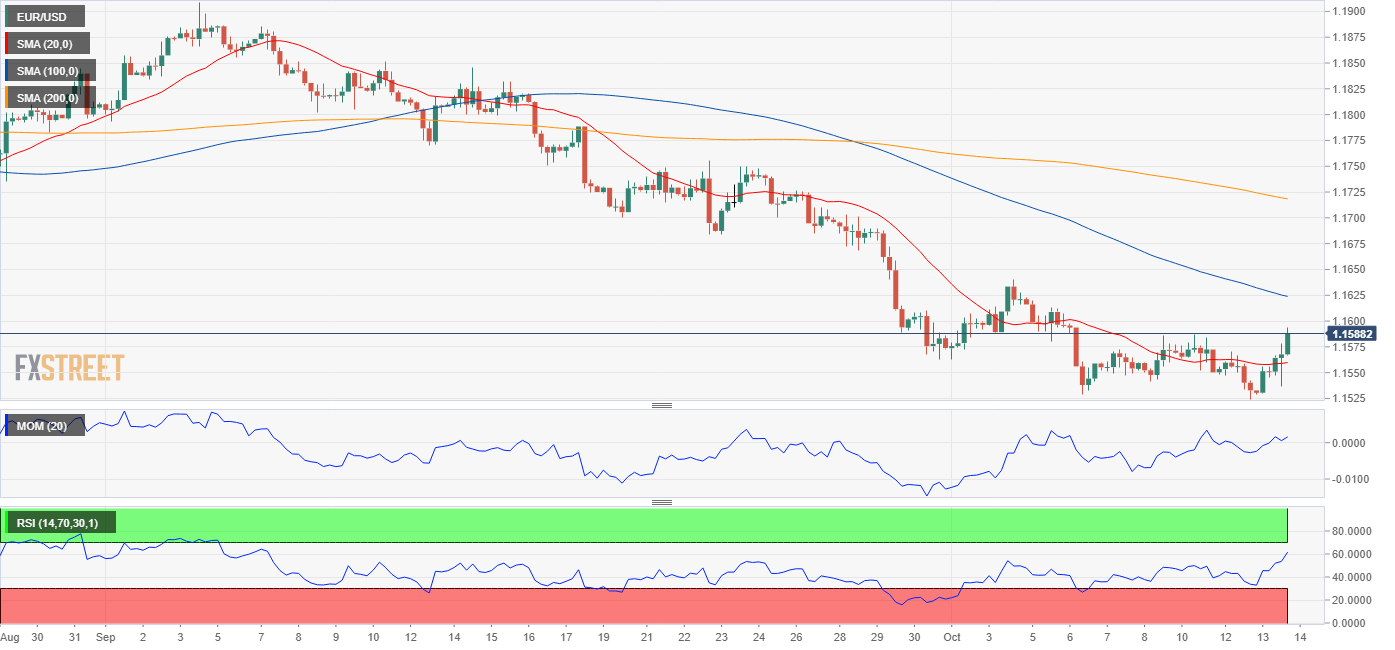
EUR/USD Current price: 1.1588
- US inflation was upwardly revised to 5.4% YoY in September, core confirmed at 4%.
- FOMC Meeting Minutes were signalling a gradual reduction in the pace of asset purchases.
- EUR/USD holds on to intraday gains just below the 1.1600 figure.

The EUR/USD pair recovered from a fresh 2021 low of 1.1523 posted in the Asian session, as the dollar suffered a major setback on the back of plummeting US government bond yields. The pair neared the 1.1600 price zone, holding nearby ahead of the Asian opening. Yields were weaker ever since the day started but accelerated their slump following the release of US inflation data. The September Consumer Price Index was upwardly revised to 5.4% YoY from a previous estimate of 5.3%, while the core annual reading was confirmed at 4%.
Germany also published September inflation figures. The Consumer Price Index was rose 0.3% MoM and 4.1% YoY as expected. The EU August Industrial Production was up 5.1% YoY, beating expectations, although it declined 1.6% from a month earlier.
Finally, the US Federal Reserve published the Minutes of its latest meeting. As expected, the document showed that policymakers are ready to kick-start tapering, a gradual reduction in the pace of asset purchases, aiming to end it in mid-2022.


The European macroeconomic calendar has nothing to offer on Thursday, while the US will publish the September Producer Price Index and Initial Jobless Claims for the week ended October 8.
EUR/USD short-term technical outlook
The EUR/USD pair traded as high as 1.1593, now developing a few pips below the level. The daily chart shows that the current recovery could well be seen as corrective, as the pair remains below a firmly bearish 20 SMA, currently at around 1.1640. The Momentum indicator remains flat within negative levels while the RSI indicator has bounced from oversold readings, holding within negative levels.
The 4-hour chart shows a tepid bullish momentum, as the pair is above a directionless 20 SMA, although below the larger ones, which maintain their bearish slopes. At the same time, technical indicators advanced within positive levels but are losing strength upward. Bulls may have better chances if the pair extends its advance beyond 1.1640.
Support levels: 1.1550 1.1520 1.1475
Resistance levels: 1.1640 1.1685 1.1730
Image Sourced from Pixabay
The preceding post was written and/or published as a collaboration between Benzinga’s in-house sponsored content team and a financial partner of Benzinga. Although the piece is not and should not be construed as editorial content, the sponsored content team works to ensure that any and all information contained within is true and accurate to the best of their knowledge and research. This content is for informational purposes only and not intended to be investing advice.
© 2025 Benzinga.com. Benzinga does not provide investment advice. All rights reserved.
Trade confidently with insights and alerts from analyst ratings, free reports and breaking news that affects the stocks you care about.

