
The following post was written and/or published as a collaboration between Benzinga’s in-house sponsored content team and a financial partner of Benzinga.
EUR/USD Current price: 1.1550
- US employment data resulted upbeat ahead of the Nonfarm Payrolls report.
- European macroeconomic figures missed the market’s expectations, hurting the EUR.
- EUR/USD is technically bearish, oversold conditions not enough to trigger a bounce.

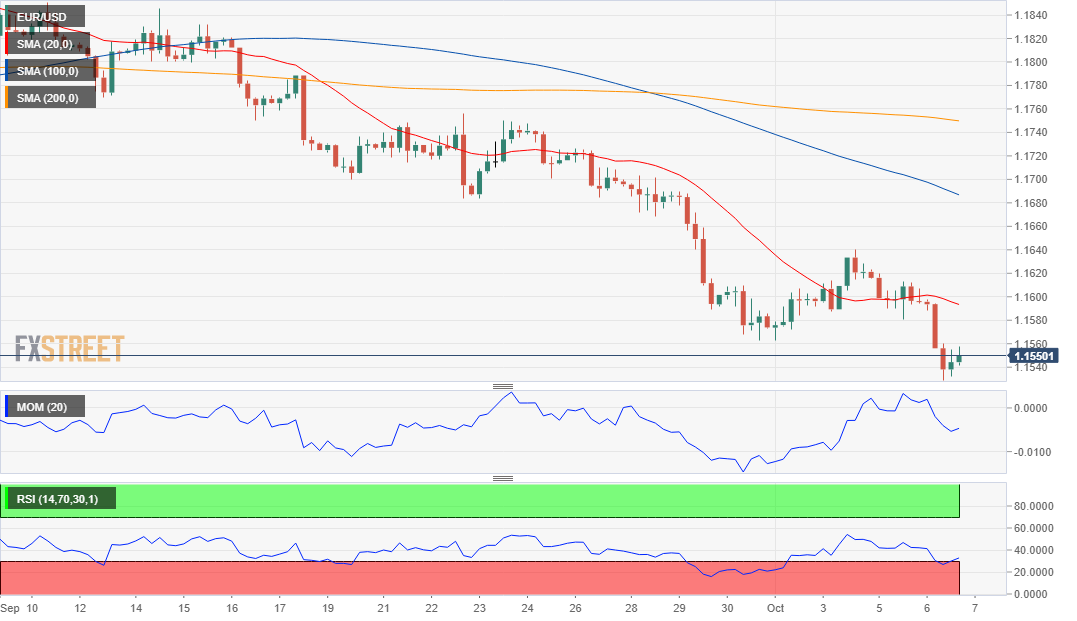
The EUR/USD pair trades at around 1.1550, not far from a fresh 2021 low of 1.1528. The pair fell on the back of persistent risk-aversion and dismal European data. Concerns about continued inflationary pressures coupled with global bottlenecks reports in the supply chain weighing on growth perspectives.
German Factory Orders unexpectedly fell 7.7% in August, much worse than the -2.1% expected, while EU Retail Sales rose a modest 0.3% MoM, below the expected 0.8%. On the other hand, US employment-related data surprised positively. The ADP survey on private job creation printed at 568K in September, hinting at a robust US Nonfarm Payrolls report scheduled for Friday.
Global equities traded in the red, although European and American indexes managed to settle off their intraday lows, with Wall Street managing to flirt with the green ahead of the close. Meanwhile, US government bond yields jumped after the ADP release, with that on the 10-year Treasury note peaking at 1.573%. Yields retreated ahead of the close and finished the day little changed at around 1.53%.
Trending Investment Opportunities


On Thursday, Germany will publish August Industrial Production, foreseen at -0.4% MoM, while the US Initial Jobless Claims foreseen at 350K in the week ended October 1. Also, the country will publish September Challenger Job Cuts
EUR/USD short-term technical outlook
The EUR/USD pair consolidates losses at the end of the American session, at levels last seen in July 2020. The decline could continue according to technical readings in the daily chart, as indicators maintain their bearish slopes, with the RSI within oversold readings. The 20 SMA keeps accelerating south below the longer ones and above the current price, indicating substantial selling interest.
In the near term and according to the 4-hour chart, the slide paused, but there are no signs of bearish exhaustion. The 20 SMA is gaining bearish strength at around 1.1590, while the Momentum indicator heads firmly south within negative levels. The RSI consolidates at around 32, reflecting price action instead of suggesting a change in the dominant bearish trend.
Support levels: 1.1520 1.1475 1.1440
Resistance levels: 1.1590 1.1640 1.1685
Image Sourced from Pixabay
The preceding post was written and/or published as a collaboration between Benzinga’s in-house sponsored content team and a financial partner of Benzinga. Although the piece is not and should not be construed as editorial content, the sponsored content team works to ensure that any and all information contained within is true and accurate to the best of their knowledge and research. This content is for informational purposes only and not intended to be investing advice.
© 2025 Benzinga.com. Benzinga does not provide investment advice. All rights reserved.