Bitcoin’s Stock to Flow (S2F) model is one of the leading quantitative models that aims to predict the price of Bitcoin until 2026. Since the price of Bitcoin in the next three years is a matter of much debate in the cryptocurrency and traditional financial markets alike, it’s important to assess well-established price models periodically considering the pace the crypto-verse is evolving at.
It is the first price model that attempts to quantify the relationship between the relative scarcity of the first-ever scarce digital currency, Bitcoin (BTC) and its price. Even though the S2F model is only an evaluation framework for Bitcoin, it is safe to say that since it gained popularity it has driven capital flows to the asset.

What is the Stock to Flow Model?
The stock-to-flow model is applicable to Bitcoin due to the scarce and limited nature of supply. The model is usually applicable to scarce commodities like gold, platinum, etc., and not widely available commodities like oil and copper. The difference is that the former only have limited supply injections and are considered to be limited in quantity, while the latter has a high supply which is theoretically considered to be limitless.
The scarcity is referred to as the metric stock to flow (SF) ratio. That’s one major factor that makes gold and bitcoin different from “consumable commodities” like copper, nickel and brass, as they have a high SF value. The high SF ratio value entails that the asset also has a low price elasticity of supply.
SF = Stock / Flow
Stock is the existing supply of Bitcoin in circulation. Flow refers to the number of tokens mined in a year. Instead of the SF ratio, the supply growth rate is also used. SF = 1 / supply growth rate.
As BTC has its max supply limited to 21 million tokens and mining a new token is a time and energy-intensive process, the supply influx of Bitcoin is limited to a certain amount that can come into circulation within a given timeframe. This model takes this scarcity and supply limitation into account while predicting the price of BTC. The calculation for the price the model predicts is based on a formula that uses variables like the monthly stock to flow value and price data.

PlanB’s model also reveals that there is an indication of a power law relationship. This is a relationship between two variables of a linear regression function, which depicts that the relative change in one quantity gives rise to a proportional change in the other quantity. This relationship exists irrespective of the initial size of those quantities. Essentially, it shows the effect of the periodic Bitcoin halving events where the SF doubles and the market value supposedly increases 10x, and this is constant for every halving event.
History of Bitcoin Stock to Flow
The Stock to Flow (S2F) model for Bitcoin was popularized by the Twitter pseudonym, PlanB, more than two years ago amid the minor bull run of Q1 2019 in March 2019. PlanB is a popular Twitter user in the crypto community who is an unnamed Dutch investor. He initially spoke about this model in a Medium Modeling article titled, “Modeling Bitcoin Value with Scarcity.”
As the title suggests, it was his attempt to price Bitcoin in proportion to its scarcity. It expands the stock to flow pricing model that is usually applicable for scarce commodities like Gold and Silver and expands it to price Bitcoin in accordance with the supply influxes that the token would witness in the next five years. It has grown to become one of the most accurate price prediction models that the crypto market has ever seen.
However, it is important to note that since quantitative financial models are usually built on historical data, it could be helpful to identify the general trends and sentiment in the market in a given timeframe, but trend aberrations are difficult to gauge in advance.
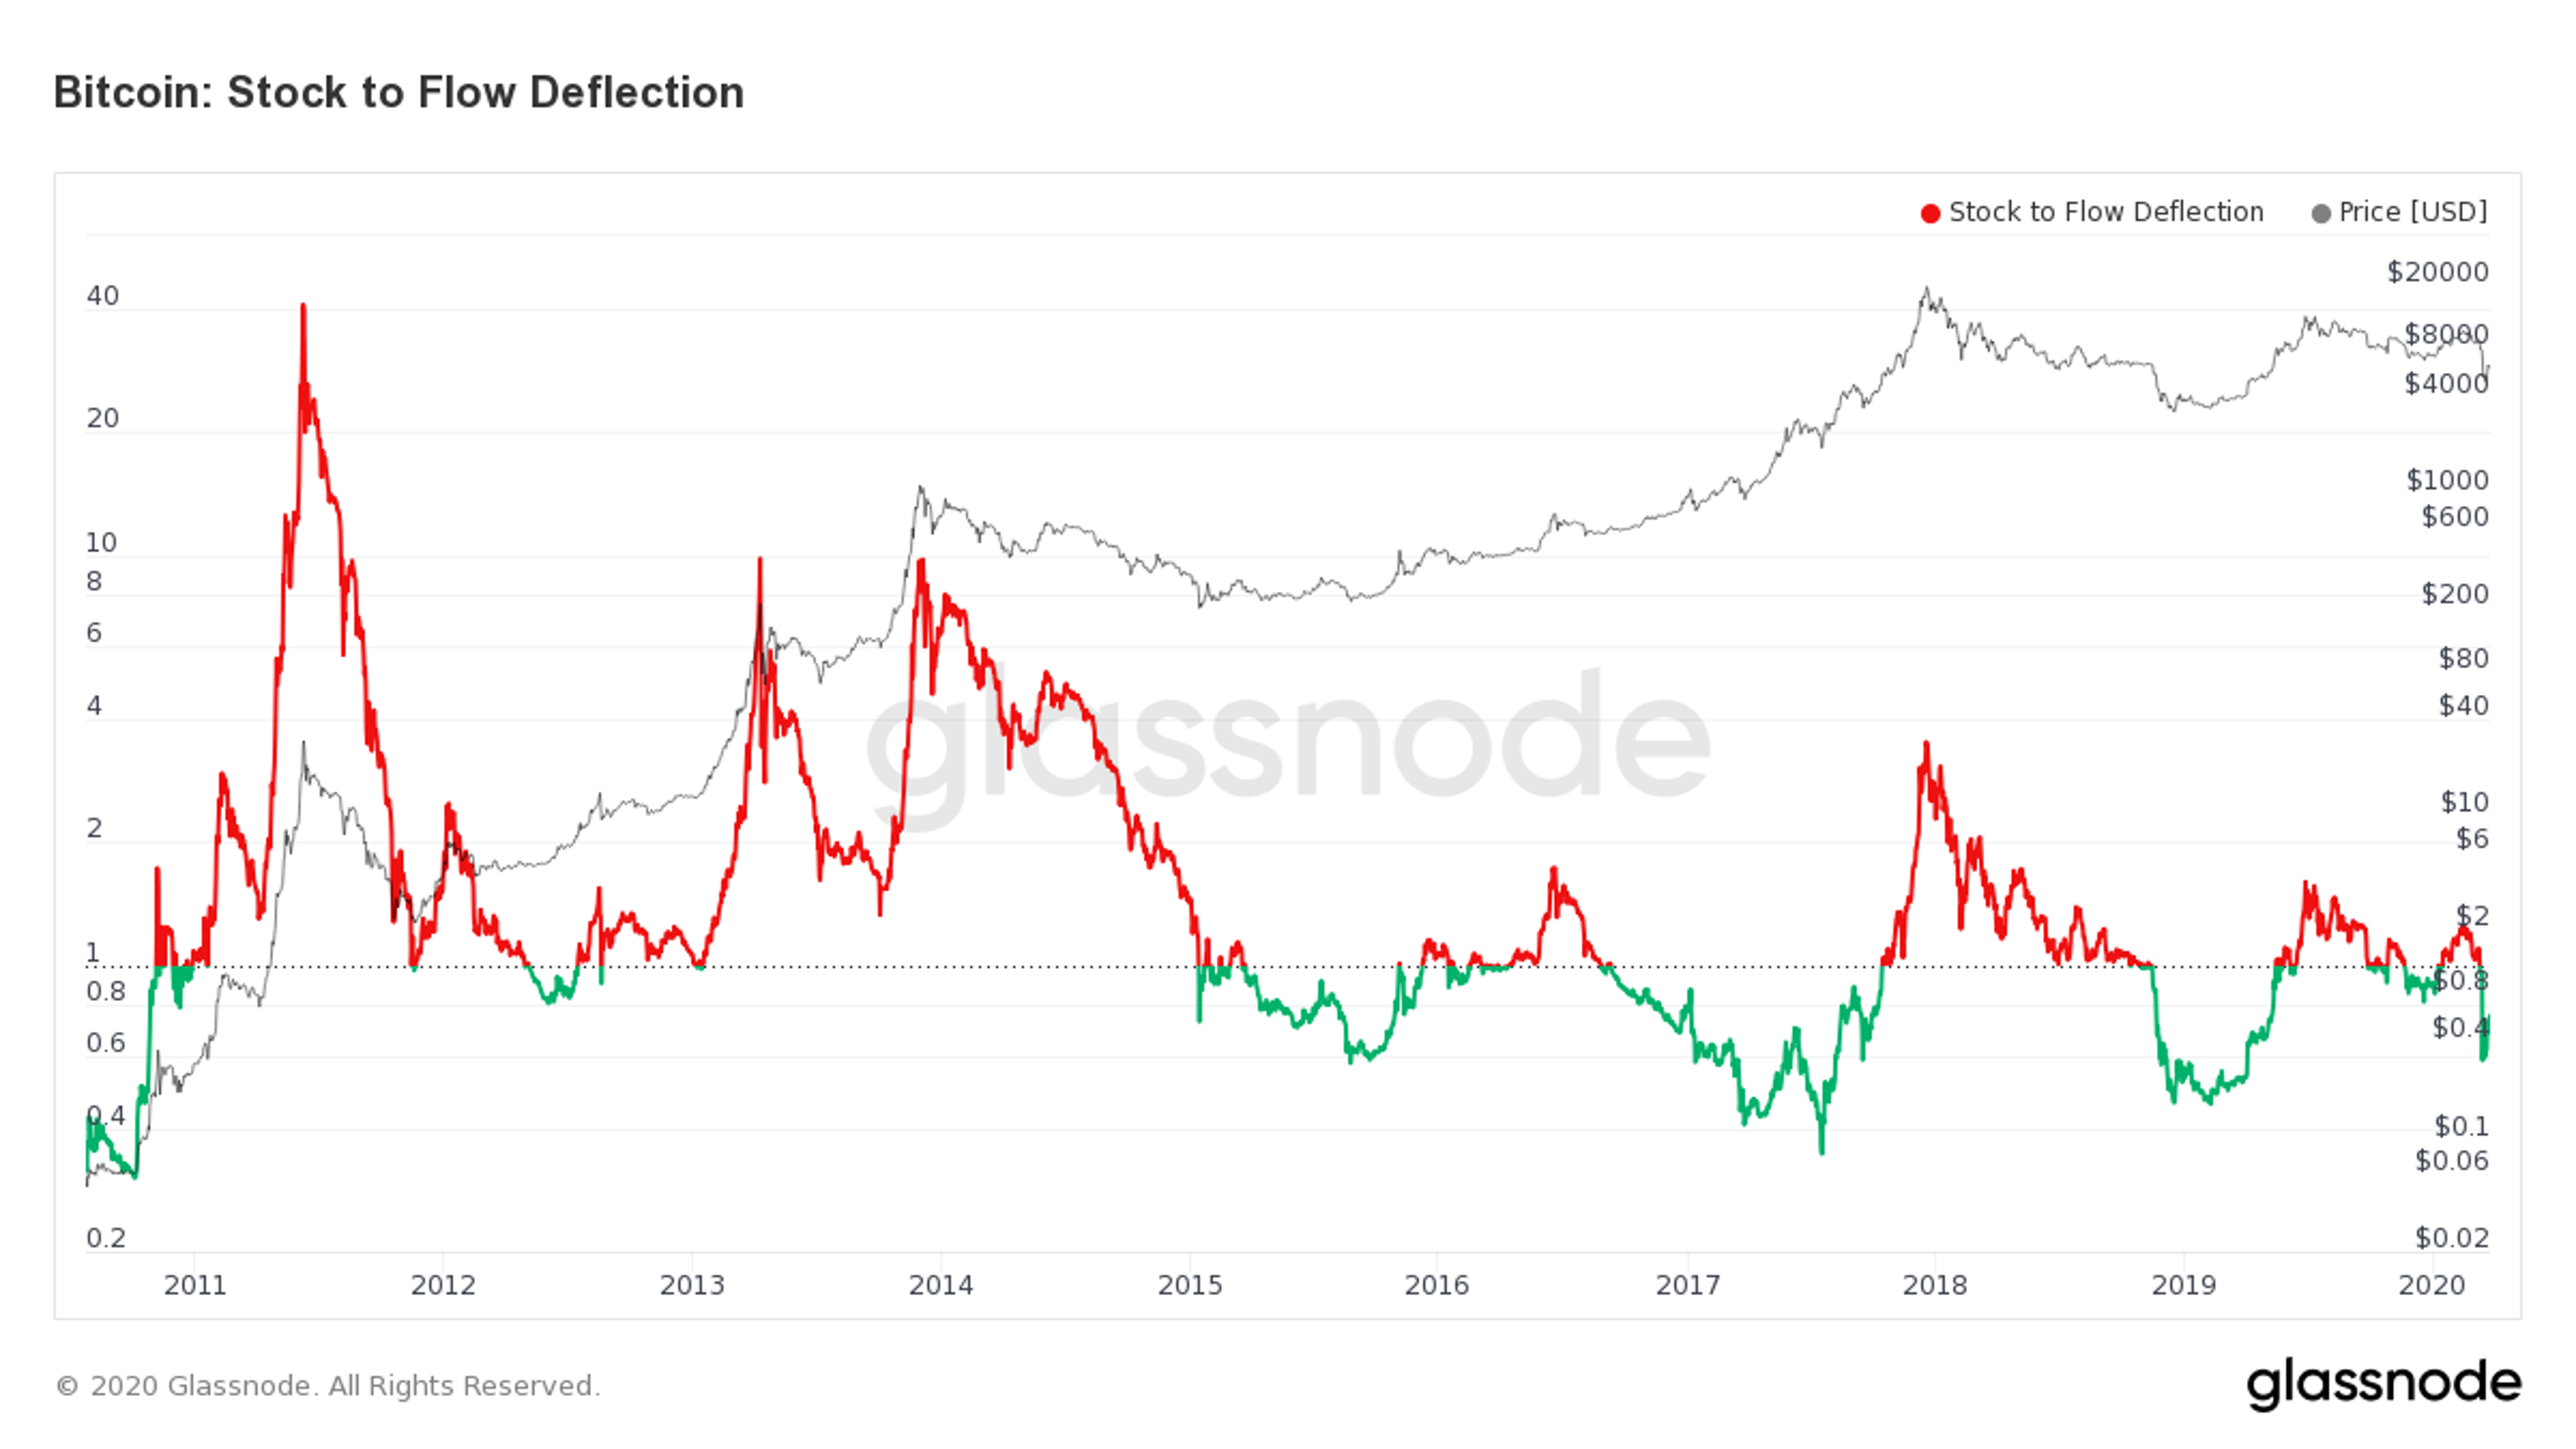
PlanB’s model has given birth to another indicator that points to whether the asset is overvalued or undervalued at a given time, based on its SF ratio, the stock to flow deflection. It is the ratio between the market price of Bitcoin to its stock to flow ratio. If the deflection is above one, according to the model, the asset is overvalued while if it is less than one, the asset is undervalued.

How to Use Bitcoin Stock to Flow Model
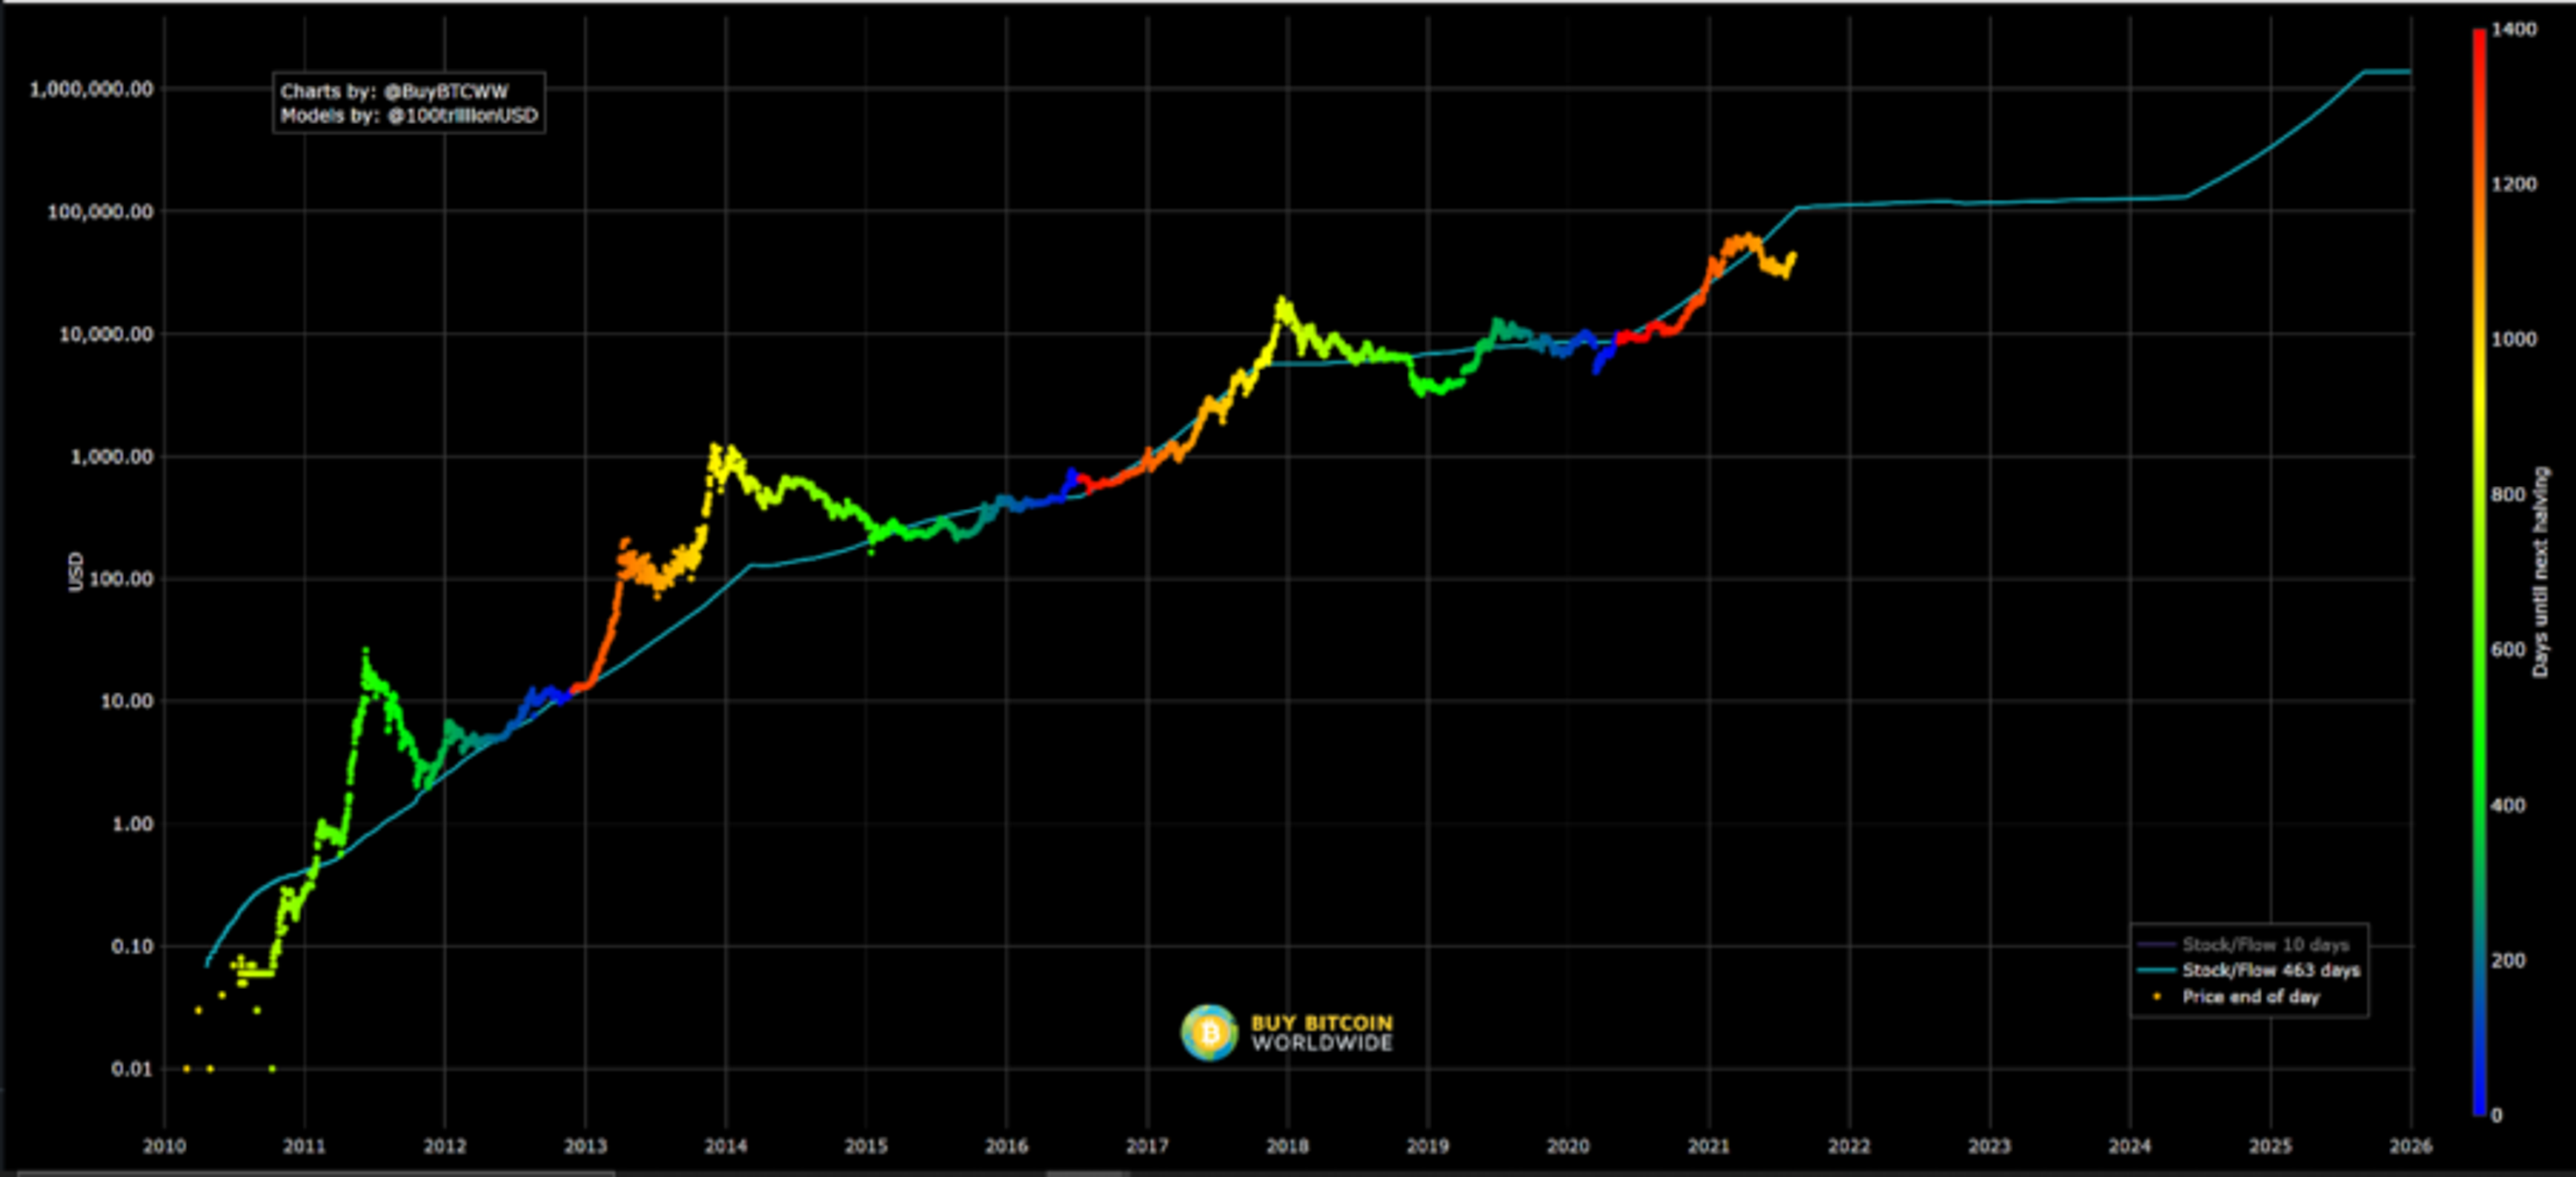
Bitcoin’s S2F model is a live chart data model that can be used easily to track the predicted price of the asset at a given point of time and the actual market price of the asset at the time. As the data points are indexed in accordance with time, it is a time series model.
The charts have the forecasted price of Bitcoin on the y-axis and the timeline from 2010 to 2026 on the x-axis. Over this line chart, the market price of Bitcoin is plotted across the chart to create a comparative view of the forecasted price vs the market price. Using this chart you can see how much the current price of Bitcoin varies from the forecasted price at a given time, historically as well.
For believers of the model, the charts combined together can also be viewed as an indicator to buy or sell the asset. Negative deviations from the forecast price line could be interpreted as signals to buy the dip while positive deviations could be construed as signs to sell as the asset is now overvalued. The stock-to-flow deflection ratio is the best metric to evaluate this.
Has the Bitcoin S2F Model been invalidated?
A closer analysis of the feasibility of the S2F model in the current market scenario is now under question. Historically, this model has been one of the most accurate price forecasting models for Bitcoin, as visible in the live data chart of the model and the stock-to-flow deflection.
Since the flash crash of the majority of the crypto market on May 19, a day now more commonly known as Black Wednesday, the price predictions of the model are often brought to question.
According to PlanB’s model, BTC’s price is supposed to have gone past $100,000 by now; as of Dec. 15, 2023, it is trading at around $43,000, less than half of the forecasted price.
In June PlanB predicted that Bitcoin’s price could reach $450,000 by the end of this year. He also mentioned that it could hit at least $135,000 in the worst-case scenario. According to the model, the price is predicted to surpass the highly coveted $1 million mark nearly 4 years from now, in July 2025.
But that prediction could seem like a stretch, an indicator of this was a poll PlanB himself held on Twitter. In June 2022, he shared the results of a poll which revealed that 41% of the poll takers have the belief that the price of Bitcoin will remain under $100,000 that year. This percentage is high compared to a similar poll he took in March 2022, which revealed that the same metric was at 16%.
However, it is important that when the second survey was taken back in June, Bitcoin was exchanging hands around the $34,000 mark. Since then, the market has seen another rebound in interest and Bitcoin is leading the charge, trading at around $43,000 at the time of writing. Market capitalization was at $650 billion at the end of July 2022 and is currently standing at $842 billion on Dec. 15.
Considering this rebound and the volatility of the cryptocurrency markets in general, it is not entirely possible to rule out any price prediction and conclusively evaluate the accuracy of PlanB’s S2F model. It is also noteworthy that even though ever since the model entered the public consciousness in March 2019 it has been fairly accurate in predicting BTC’s price, in the bull run starting late in Q4 2019, the market price of the token exceeded the forecasted price till May this year. This could also be considered as an aberration as the correlated stock to flow deflection value would indicate that the token is overvalued.
This is not the only aberration visible in the Bitcoin S2F live data chart model. Looking at the historical calculations of the value of Bitcoin according to PlanB’s model, there are several elongated positive aberrations where BTC has been over-priced as compared to the supply dynamic of the asset. The longest period for these aberrations lasts from 2013 to 2015.
As the industry and the correlated markets evolve at such a rapid pace, it is possible that there could be new quantitative valuation models that price Bitcoin in an even more accurate fashion. PlanB himself has updated the original S2F model with an updated version, the BTC Stock to Flow cross-asset (S2FX) model.
What is the Bitcoin Stock-to-Flow cross-asset model?
After the immense popularity of PlanB’s Stock-to-Flow model that piqued the interest of financial analysts around the world, in April 2020, through another Medium article, PlanB revealed another quantitative valuation model called the Bitcoin Stock-to-Flow cross-asset (S2FX) model.
This new model aims to solidify the basis of the currently used S2F model by removing time as a variable and even adding other similar scarce assets like silver and gold. Essentially, it enables the valuation of BTC, gold and silver using just one formula. To explain this model, PlanB uses the concept of phase transition to explain how assets behave differently at various stages of its lifecycle.
Frequently Asked Questions
Who created Bitcoin's stock to flow model?
Bitcoin’s stock-to-flow model was created by a pseudonymous analyst and trader known as “PlanB” in March 2019.
What is Bitcoin's stock to flow model?
Is Bitcoin stock to flow model accurate?
Bitcoin stock to flow model can be surprisingly accurate.
- Exclusive Crypto Airdrops
- Altcoin of the Week
- Insider Interviews
- News & Show Highlights
- Completely FREE