
New York City REIT Inc. NYC slumped to even lower lows this week and now trades below $2 after going for $13 as recently as April.
Many real estate investment trusts (REITs) have had a challenging year with the Federal Reserve steadily taking interest rates higher. Few, however, have experienced the relentless selling of this REIT.
New York City REIT invests in properties in all five boroughs of the Big Apple, but most of the portfolio is concentrated in Manhattan. Funds from operations (FFO) for the third quarter showed a negative $4.1 million. It may be difficult for the company to maintain the current dividend yield of 21.7%.
With a market capitalization of $27.77 million, New York City REIT is small compared to most of the other New York Stock Exchange-traded real estate investment trusts. Average daily volume is relatively light with just 27,797 shares traded. The REIT is trading at just 0.08% of its book value, a very low figure.
The last news item on the company’s website is dated Sept. 6, and reads “NYC Advisor and Its Affiliates Express Confidence in NYC REIT With $2.5 Million Share Purchase, Stock Election.”
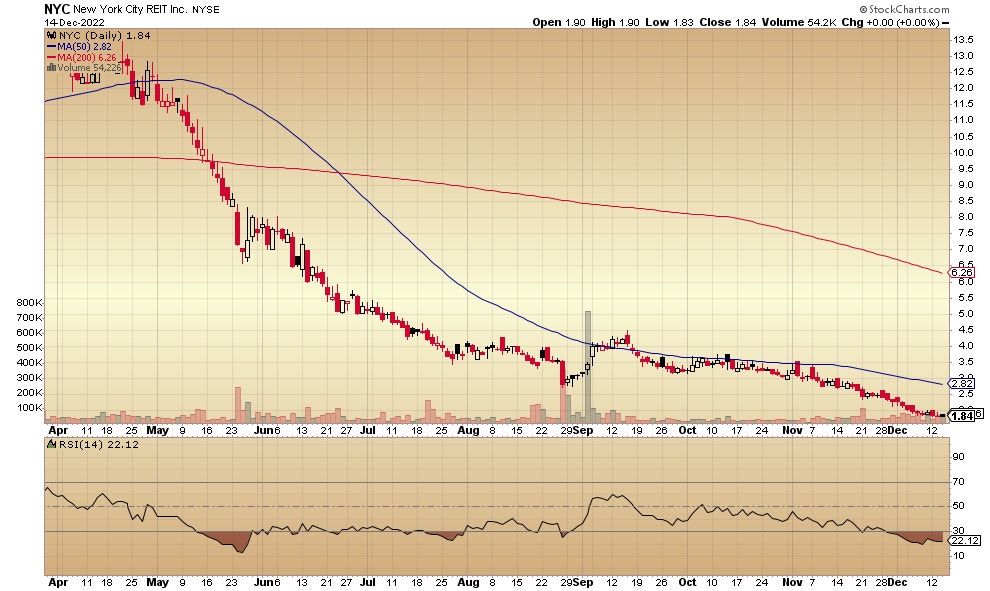
The daily price chart for New York City REIT looks like this:

Start generating passive income through real estate
Check out these featured investments from Benzinga's Real Estate Offerings Screener.
The slide from April to late August is extraordinarily deep, and the September rally only helped for a relatively brief moment. From the spring peak of $13 to the current price of $1.84 represents an 86% drop in value. The REIT is trading well below both the downtrending 50-day moving average (the blue line) and the 200-day moving average (the red line). The relative strength indicator (RSI) below the price chart has dropped into the Oversold range.
Here’s the monthly chart for New York City REIT:
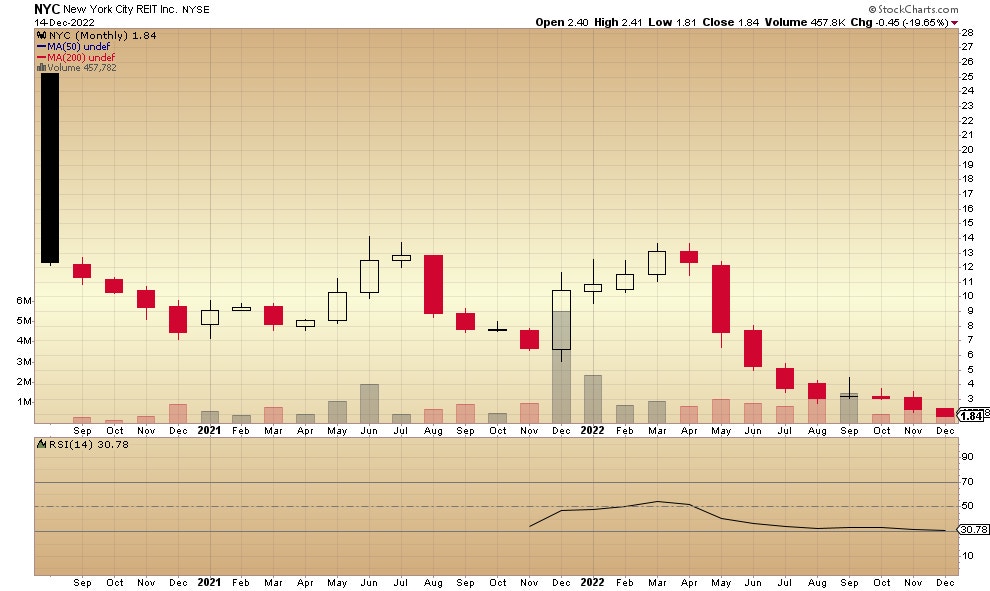
After the company’s initial public offering in August 2020, it never made it back to that month’s high.
Weekly REIT Report: REITs are one of the most misunderstood investment options, making it difficult for investors to spot incredible opportunities until it’s too late. Benzinga’s in-house real estate research team has been working hard to identify the greatest opportunities in today’s market, which you can gain access to for free by signing up for Benzinga’s Weekly REIT Report.
More on Real Estate from Benzinga
- Bezos-Backed Startup Lets You Become A Landlord With $100
- You Can Become Part-Owner Of This Cash-Flowing Multifamily Real Estate Portfolio
- This Little-Known REIT Is Producing Double-Digit Returns In A Bear Market: How?
Charts courtesy of StockCharts
© 2025 Benzinga.com. Benzinga does not provide investment advice. All rights reserved.