First, investors should appreciate the fundamental strengths of the business. As a royalty and streaming specialist, Royal Gold doesn't primarily involve itself in precious metal extraction. Instead, it offers cash upfront to producers. In exchange, Royal Gold either receives a fixed percentage of the revenue from a mine's production (royalty) or it exercises the right to buy the metal at a fixed, discounted price (streaming).
In contrast, producers see relatively static margins with costs rising when the gold price swings northward. That's because miners must deal with myriad issues, such as inflation, labor, energy and material costs. Again, with Royal Gold, the cost is generally fixed, facilitating business predictability.
Striking Quantitative Gold with RGLD Stock
If I may get down to brass tacks, at the core of every trading article is an actionable thesis: either you're buying the stock, selling it or playing the volatility game (either on the debit or credit side). You're almost certainly not here because Royal Gold and its royalty and streaming business model is literally riveting.
We can also reasonably presume that, if I'm writing a bullish article on RGLD stock, I believe (unless otherwise explicitly stated) that the security is currently traded at a "good price." However — and this is the tricky part — I would be committing a presuppositional fallacy if I don't define what "good" means.
It's language that permeates across the financial analysis industry. Essentially, by stating that RGLD stock is at a "good price" without defining the term, I would be smuggling the conclusion (that RGLD is attractive) into the undefined premise (that "good" has objective, shared meaning in the market).
Here's the objective truth of the equities sector: at the end of the day, the market is either a net buyer or a net seller. That's it.
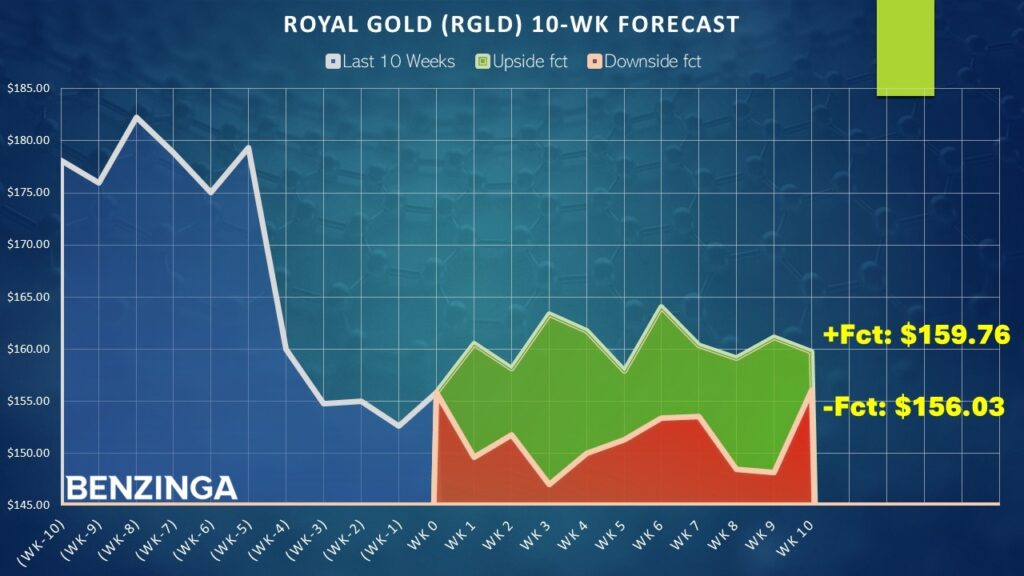
So, what I observe in the last 10 complete weeks (a nice round number that I arbitrarily chose), the market voted to buy RGLD stock two times and sell eight times. During this period, the security incurred a downward trajectory. For brevity, we can label this sequence as 2-8-D.
Now, we have a voting record or a behavioral state that we can filter for in our dataset (which extends back to January 2019) to see how investors typically respond to it. In addition, we can compare this signal to other frequently recurring patterns over the same 10-week interval to help formulate a decision-tree logic:
From the table above, the chance that a long position in RGLD stock may rise on any given week (the baseline probability) is 50.73%. This is effectively our null hypothesis, the assumption of no mispricing. What we're trying to say is that, because of the 2-8-D sequence flashing, the odds of upside in the following week stand at 71.43%.
In other words, based on a descriptive methodology, RGLD stock appears to be favorably mispriced. Based on Friday's close of $152.64, RGLD is forecasted to land at approximately $157.19 since the median return (assuming the positive pathway) is 2.98%. However, because of the upcoming earnings report, there could be the chance for an unusually robust move higher.
Two Options on the Table
At time of writing, market makers are offering the 155/160 bull call spread expiring Aug. 15 at an arguably compelling price. This transaction involves buying the $155 call and simultaneously selling the $160 call, for a net debit paid of $245 (the most that can be lost in the trade). Should RGLD stock rise through the short strike price ($160) at expiration, the maximum profit is $255, a payout of over 104%.
While the breakeven price of the above trade is $157.45 and thus above the projected median return of the 2-8-D sequence, a positive reception to Royal Gold's second-quarter earnings — especially after a wave of distributive sessions — could send RGLD stock dramatically higher.
For the most aggressive speculator, the 160/165 bull spread (also expiring Aug. 15) could be in play. This transaction features a lower net debit of $140 but a much higher breakeven price of $161.40. Here, Royal Gold needs to come through or else this will be a busted trade. However, the max payout is over 257%.
Either way, much rides on the statistical viability of the 2-8-D sequence. Running a one-tailed binomial test reveals a p-value of 0.0971, which means that there's a 9.71% chance that the implications of the signal could materialize randomly as opposed to intentionally. That doesn't quite meet the threshold of statistical significance at 5%. However, given the market's open and entropic system, a p-value less than 0.10 is empirically intriguing.
While I don't like to resort to whataboutisms to strengthen my argument, it's at this point where you do have to ask what the p-value is for a head-and-shoulders pattern or a cheap EV/EBITDA-capex ratio? To be clear, I don't guarantee a positive outcome, but I genuinely believe that an empirically backed analysis offers a consistent edge over statistically unanchored methodologies.
Read Next:
Photo: Shutterstock
© 2026 Benzinga.com. Benzinga does not provide investment advice. All rights reserved.
To add Benzinga News as your preferred source on Google, click here.