


Zinger Key Points
- Ethereum and Dogecoin are trading above the 200-day SMA, while Bitcoin remains under that level.
- Bitcoin and Ethereum are likely to pull back to print a higher low because their RSI levels are overbought.
- See how Matt Maley is positioning for post-Fed volatility and momentum—live this Sunday, June 22 at 1 PM ET.
Bitcoin BTC/USD was spiking up more than 2% higher during Friday’s 24-hour trading session, coming close to tagging the 200-day simple moving average (SMA) in tandem with the S&P 500, which was behaving similarly.
Ethereum ETH/USD regained the 200-day SMA on Thursday and Dogecoin popped above the area on Monday.
The 200-day SMA is an important bellwether. Technical traders and investors consider a stock trading above the level on the daily chart to be in a bull cycle, whereas a stock trading under the 200-day SMA is considered to be in a bear cycle.
The 50-day SMA also plays an important role in technical analysis, especially when paired with the 200-day. When the 50-day SMA crosses below the 200-day SMA, a death cross occurs whereas when the 50-day SMA crosses above the 200-day, a bullish golden cross takes place.
While a golden cross occurred on Dogecoin’s chart on Nov. 10, the 50-day SMA remains trending under the 200-day on Bitcoin and Ethereum’s charts.
Want direct analysis? Find me in the BZ Pro lounge! Click here for a free trial.
The Bitcoin Chart: Bitcoin started trading in an uptrend on Dec. 30 and had since printed a few higher highs and higher lows on the daily chart. The most recent higher low was formed on Jan. 6 at $16,670 and the most recent confirmed higher high was printed on that same day at $17.027.
Since then, Bitcoin has surged almost 15% higher, without retracing to print a higher low. This indicated a retracement to the downside was likely on the horizon.
The crypto was also likely to trade lower or consolidate over the next few days because Bitcoin’s relative strength index (RSI) was measuring in at about 84%. When a stock’s or crypto’s RSI reaches or exceeds the 70% level, it becomes overbought, which can be a sell signal for technical traders.
The consolidation or retracement was likely to come when Bitcoin reaches the 200-day SMA on the daily chart because it’s a strong area of support and resistance.


Bitcoin has resistance above at $19,915 and $20,545 and support below at $18,835 and $17,580.


Like Bitcoin, Ethereum was trading in a strong uptrend, with the most recent higher low formed on Jan. 6 at $1,234.20 and the most recent confirmed higher high created at $1,276.60 on the same day. Also, like Bitcoin, Ethereum hadn’t printed a higher low in many trading sessions, which made a retracement likely.
Ethereum has resistance above at $1,421.80 and $1,564.17 and support below at $1,308.89 and $1,231.38.

Dogecoin was also working to print a doji candlestick. When a doji candlestick is created in an uptrend it can signal the temporary top is in. Dogecoin may need to consolidate under the 50-day SMA before gaining enough power to break up above the level.
Unlike Bitcoin and Ethereum, Dogecoin’s RSI wasn’t in overbought territory, which suggested the crypto had room to surge further without becoming overbought.
Dogecoin has resistance above at $0.083 and $0.091 and support below at $0.075 and $0.07.
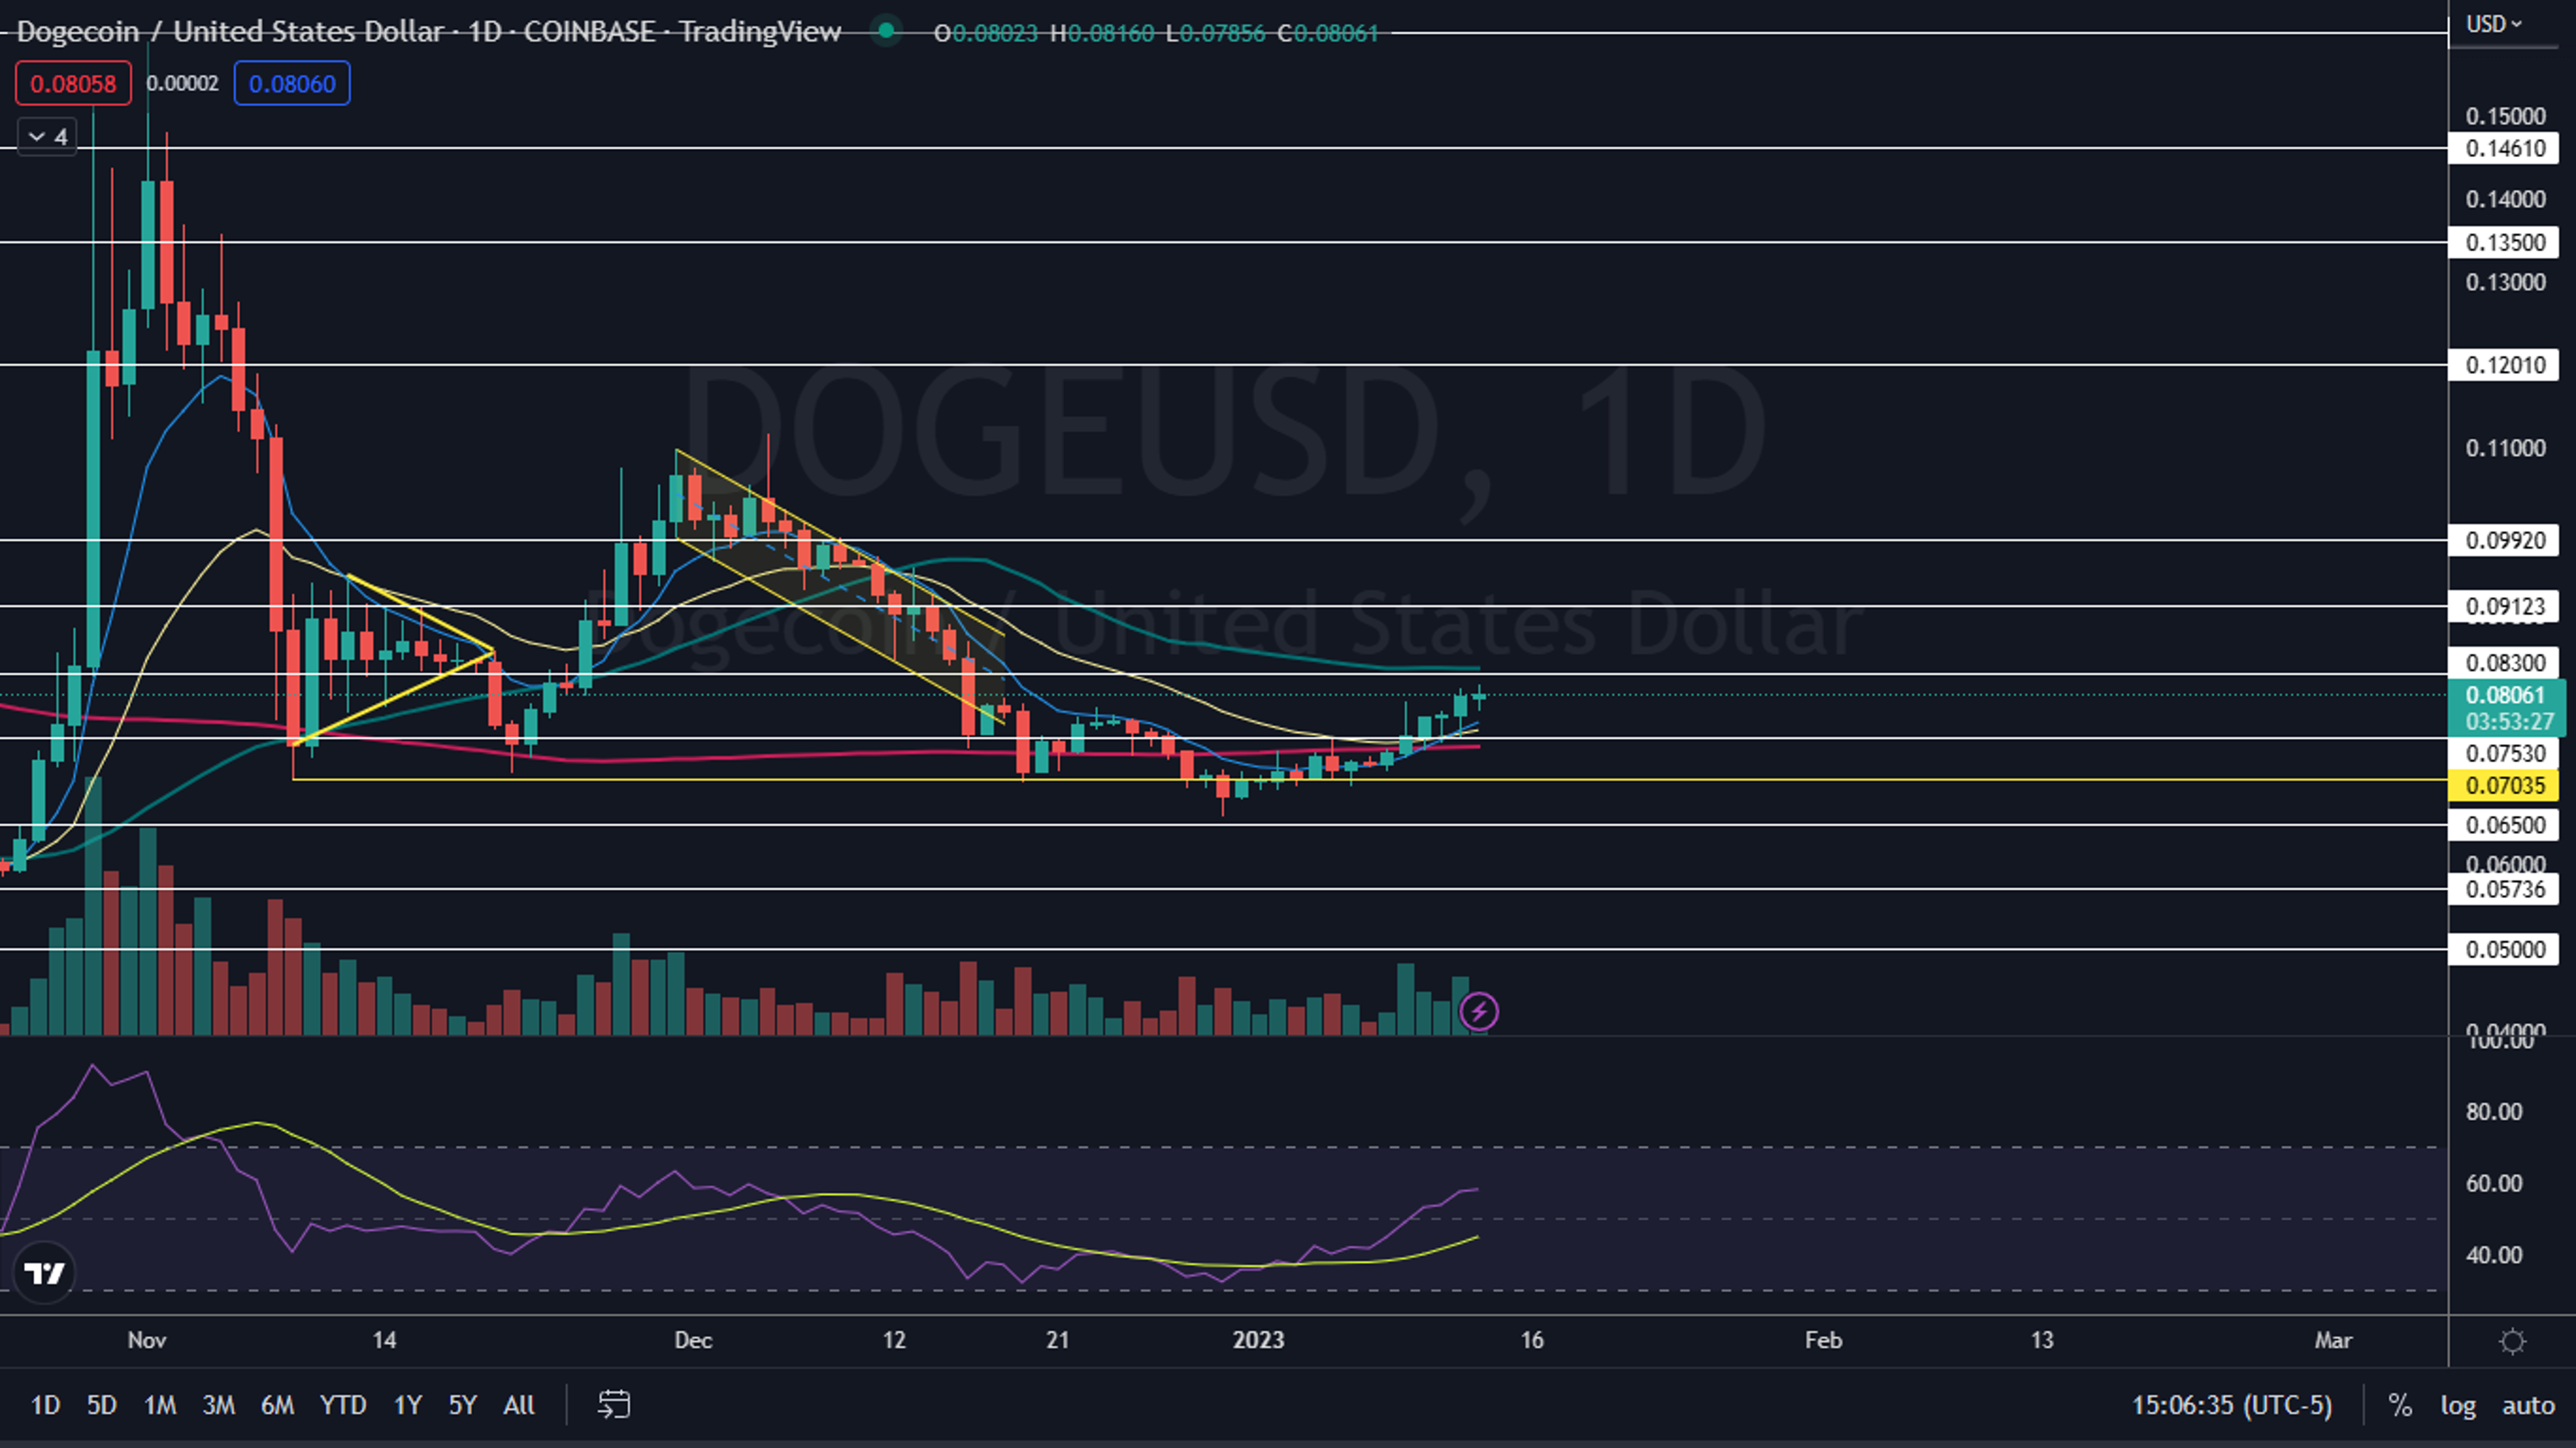
Photo: KarbonatErol via Shutterstock
Edge Rankings
Price Trend
© 2025 Benzinga.com. Benzinga does not provide investment advice. All rights reserved.
Trade confidently with insights and alerts from analyst ratings, free reports and breaking news that affects the stocks you care about.

