


Zinger Key Points
- Ethereum Classic broke bullishly from a bull flag pattern and is trading in a confirmed uptrend.
- Bullish traders want to see the next higher low print above the 200-day SMA.
- Don’t miss this list of 10 overlooked stocks—including one paying a 9% dividend—before Wall Street catches on.
Ethereum Classic ETC/USD was soaring more than 18% on Thursday after skyrocketing over 30% during Wednesday’s 24-hour trading session.
The two-day surge was due to a break up from a bull flag pattern, although the move was propelled by bullish days in both the general markets and the cryptocurrency sector following the release of the Federal Reserve’s monthly minutes, where the decision was made to hike interest rates 0.75%.
The bull flag pattern is created with a sharp rise higher forming the pole, which is then followed by a consolidation pattern that brings the stock lower between a channel with parallel lines or into a tightening triangle pattern.
- For bearish traders, the "trend is your friend" (until it's not) and the stock may continue downwards within the following channel for a short period of time. Aggressive traders may decide to short the stock at the upper trendline and exit the trade at the lower trendline.
- Bullish traders will want to watch for a break up from the upper descending trendline of the flag formation, on high volume, for an entry. When a stock breaks up from a bull flag pattern, the measured move higher is equal to the length of the pole and should be added to the lowest price within the flag.
A bull flag is negated when a stock closes a trading day below the lower trendline of the flag pattern or if the flag falls more than 50% down the length of the pole.


Want direct analysis? Find me in the BZ Pro lounge! Click here for a free trial.
The Ethereum Classic Chart: Ethereum Classic’s bull flag was formed between July 13 and July 22, with the pole created over the first seven 24-hour trading sessions of that timeframe and the flag formed over the remaining days. The measured move of the break from the pattern is 94%, which indicates Ethereum Classic could eventually make its way up to the $43 dollar mark.
- Ethereum Classic is also trading in a confirmed uptrend, with the most recent higher low formed on July 26 at $22.82 and the most recent confirmed higher high printed at the $28.20 mark on July 23. During Wednesday and Thursday’s sessions, Ethereum has continued to form higher highs but the temporary top hasn’t yet printed.
- A retracement, at least to print another consecutive higher low, is likely to come soon because Ethereum Classic’s relative strength index (RSI) is measuring in at about 80%. When a stock or crypto’s RSI reaches or rises above the 70% level it becomes overbought, which can be a sell signal for technical traders.
- Bullish traders who aren’t already in a position can watch for Ethereum Classic to print a higher low by forming a reversal candlestick on its next retracement. Traders will want to see the reversal candlestick form above the 200-day simple moving average, to indicate the bull cycle will continue.
- Ethereum Classic has resistance above at $38.95 and $41.41 and support below at $35.38 and $32.17.

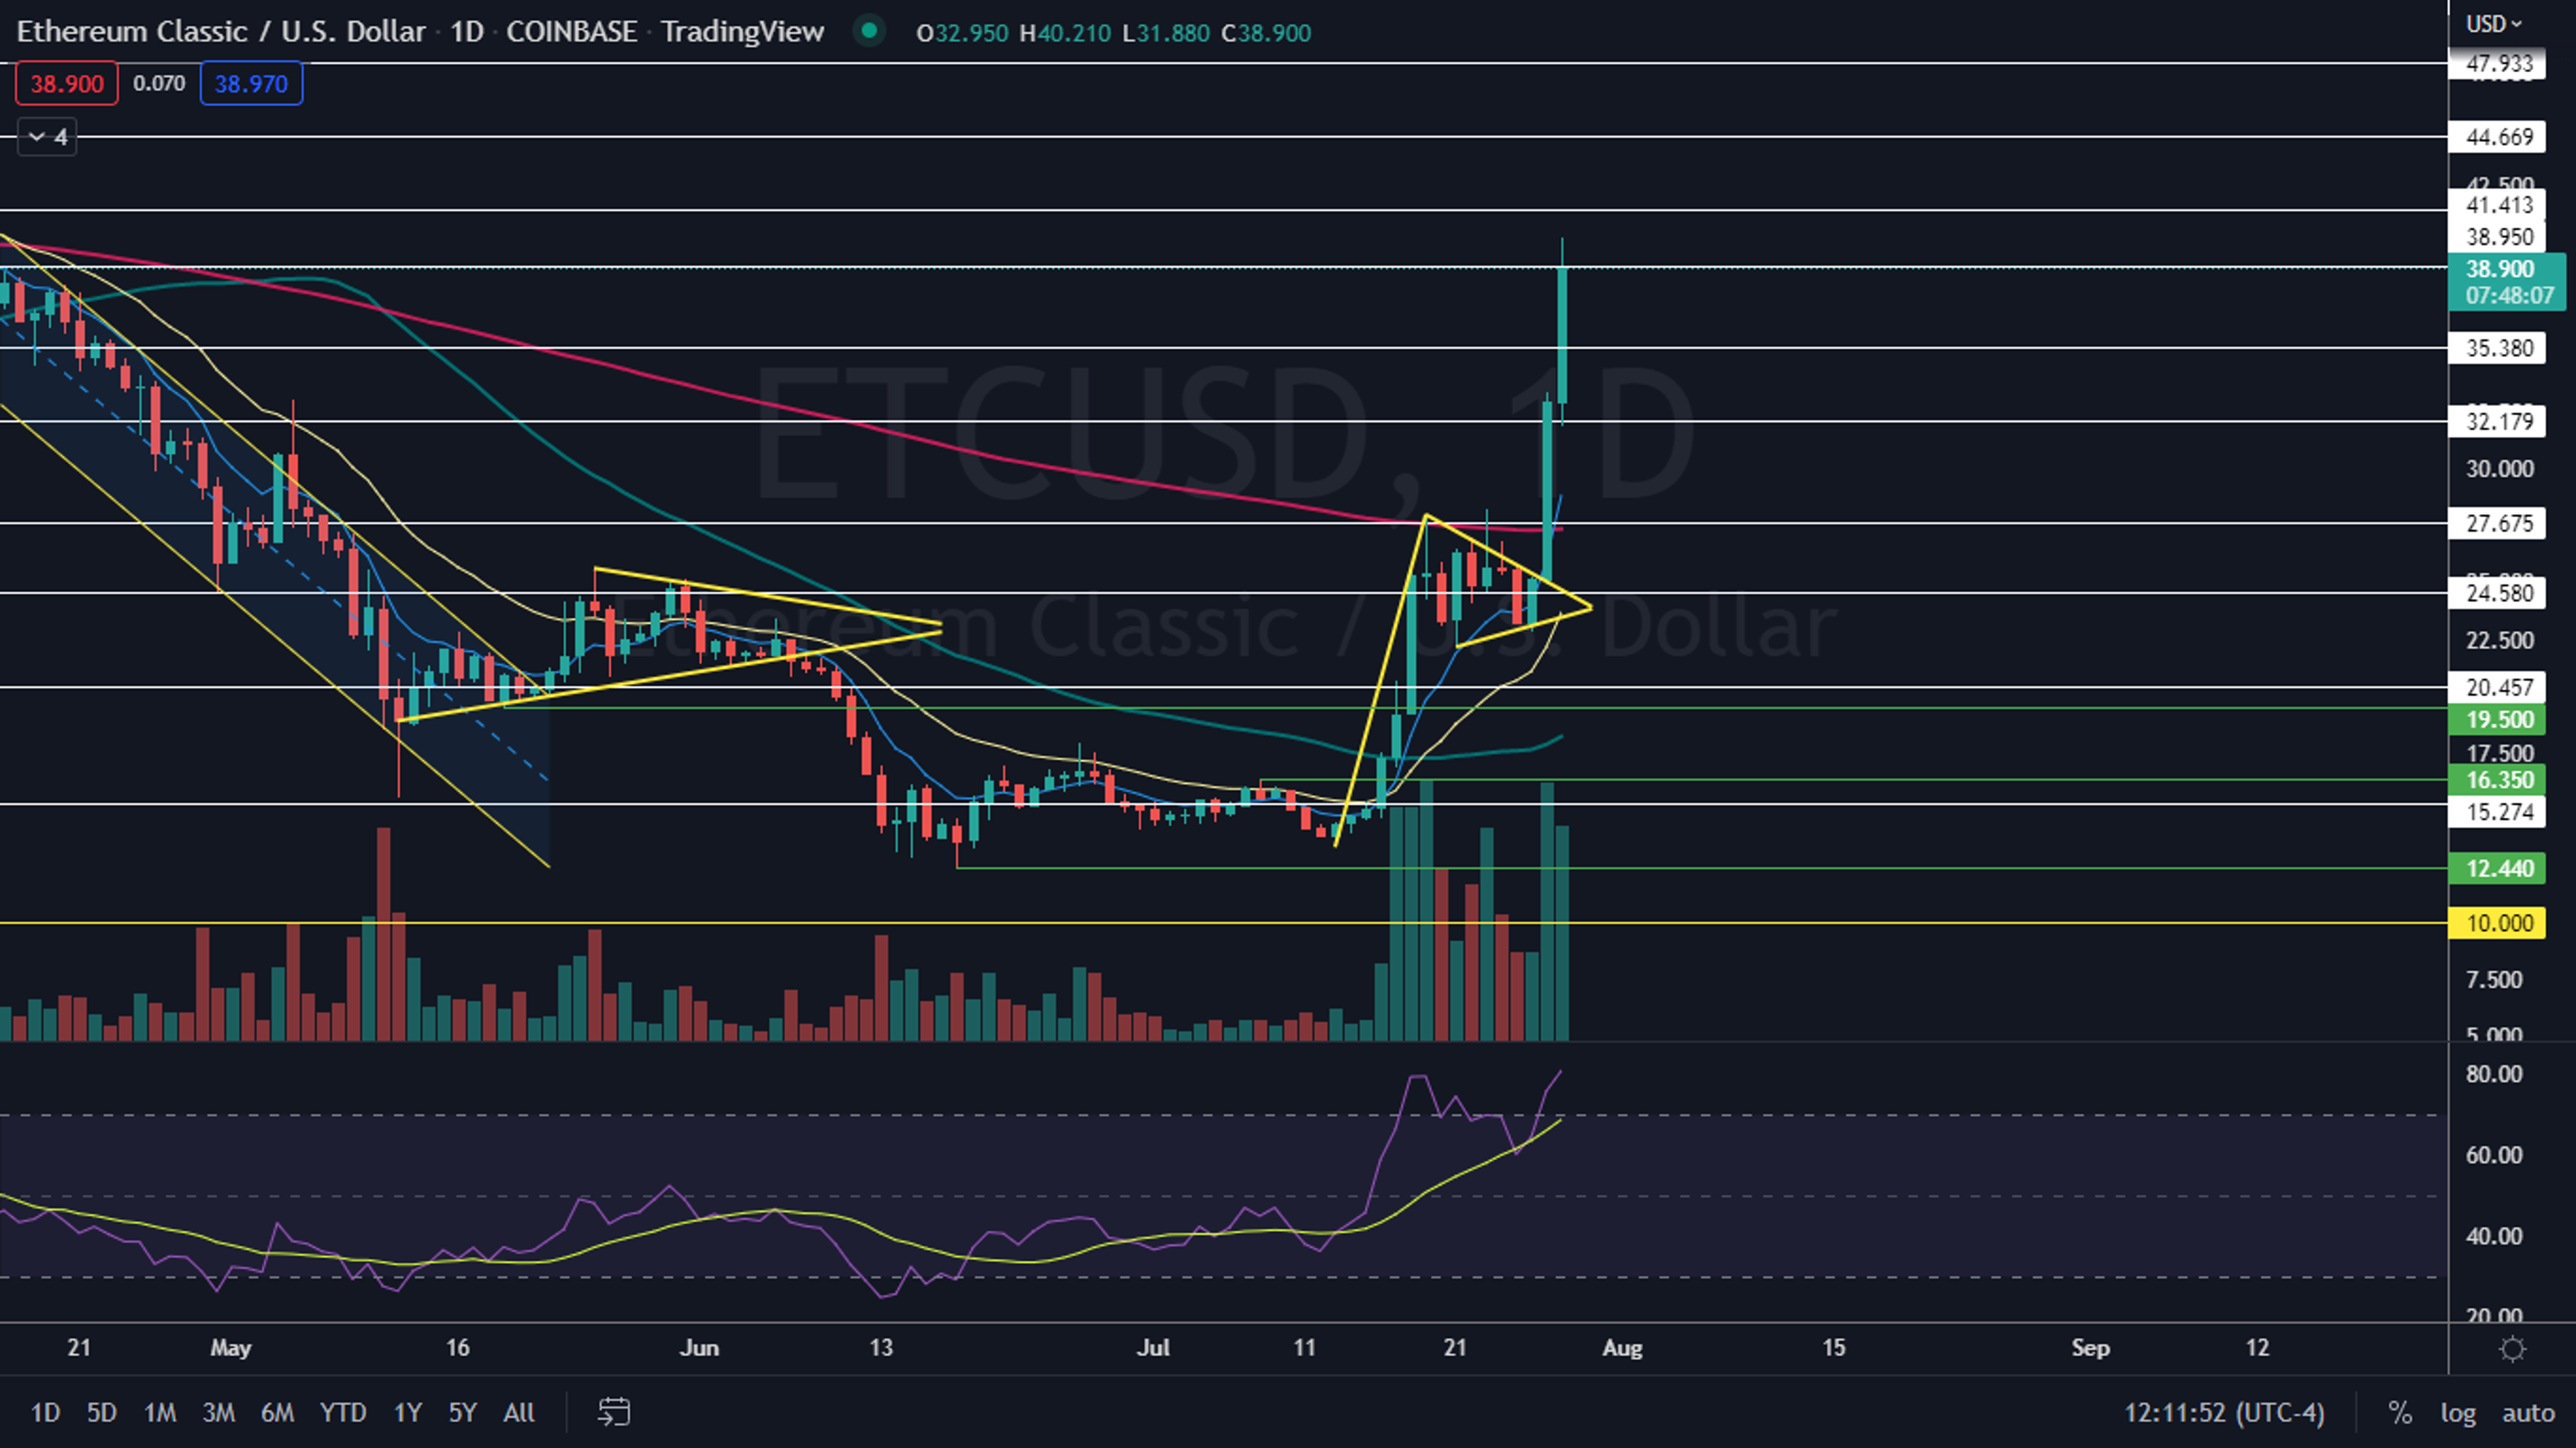
Photo: leksiv via Shutterstock
Edge Rankings
Price Trend
© 2025 Benzinga.com. Benzinga does not provide investment advice. All rights reserved.
Trade confidently with insights and alerts from analyst ratings, free reports and breaking news that affects the stocks you care about.

