

Bitcoin BTC/USD continues to be the world's largest cryptocurrency by market cap and Bitcoin Cash BTC/USD is a variant of Bitcoin created to help make transactions run smoother by increasing the block size. Bitcoin Cash sits at 13th place in terms of cryptocurrency market cap.


Bitcoin Daily Chart Analysis
- Bitcoin continues to trade in a channel and nears a key point between the channel and where the head and shoulders pattern is forming.
- Bitcoin is trading below both the 50-day moving average (green) and the 200-day moving average (blue), indicating the sentiment has recently been bearish.
- Each of these moving averages may hold as an area of resistance in the future.
Key Bitcoin Levels To Watch
- Bitcoin may be forming into a head and shoulders pattern while trading in a channel between the prices of $30,000 and $40,000
- The $40,000 level has held as resistance previously and acts as resistance for both shoulders in the head and shoulders pattern. The $30,000 level is a potential area of support as this area previously acted as support.
- The head and shoulders pattern can be seen by the orange lines on the chart. The stock is following the pattern and if Bitcoin breaks below the $30,000 level it may confirm the pattern and see a large downward push.
See also: Ethereum Vs. Ethereum Classic: Which Crypto Performed Better In June?

Bitcoin Cash Daily Chart Analysis
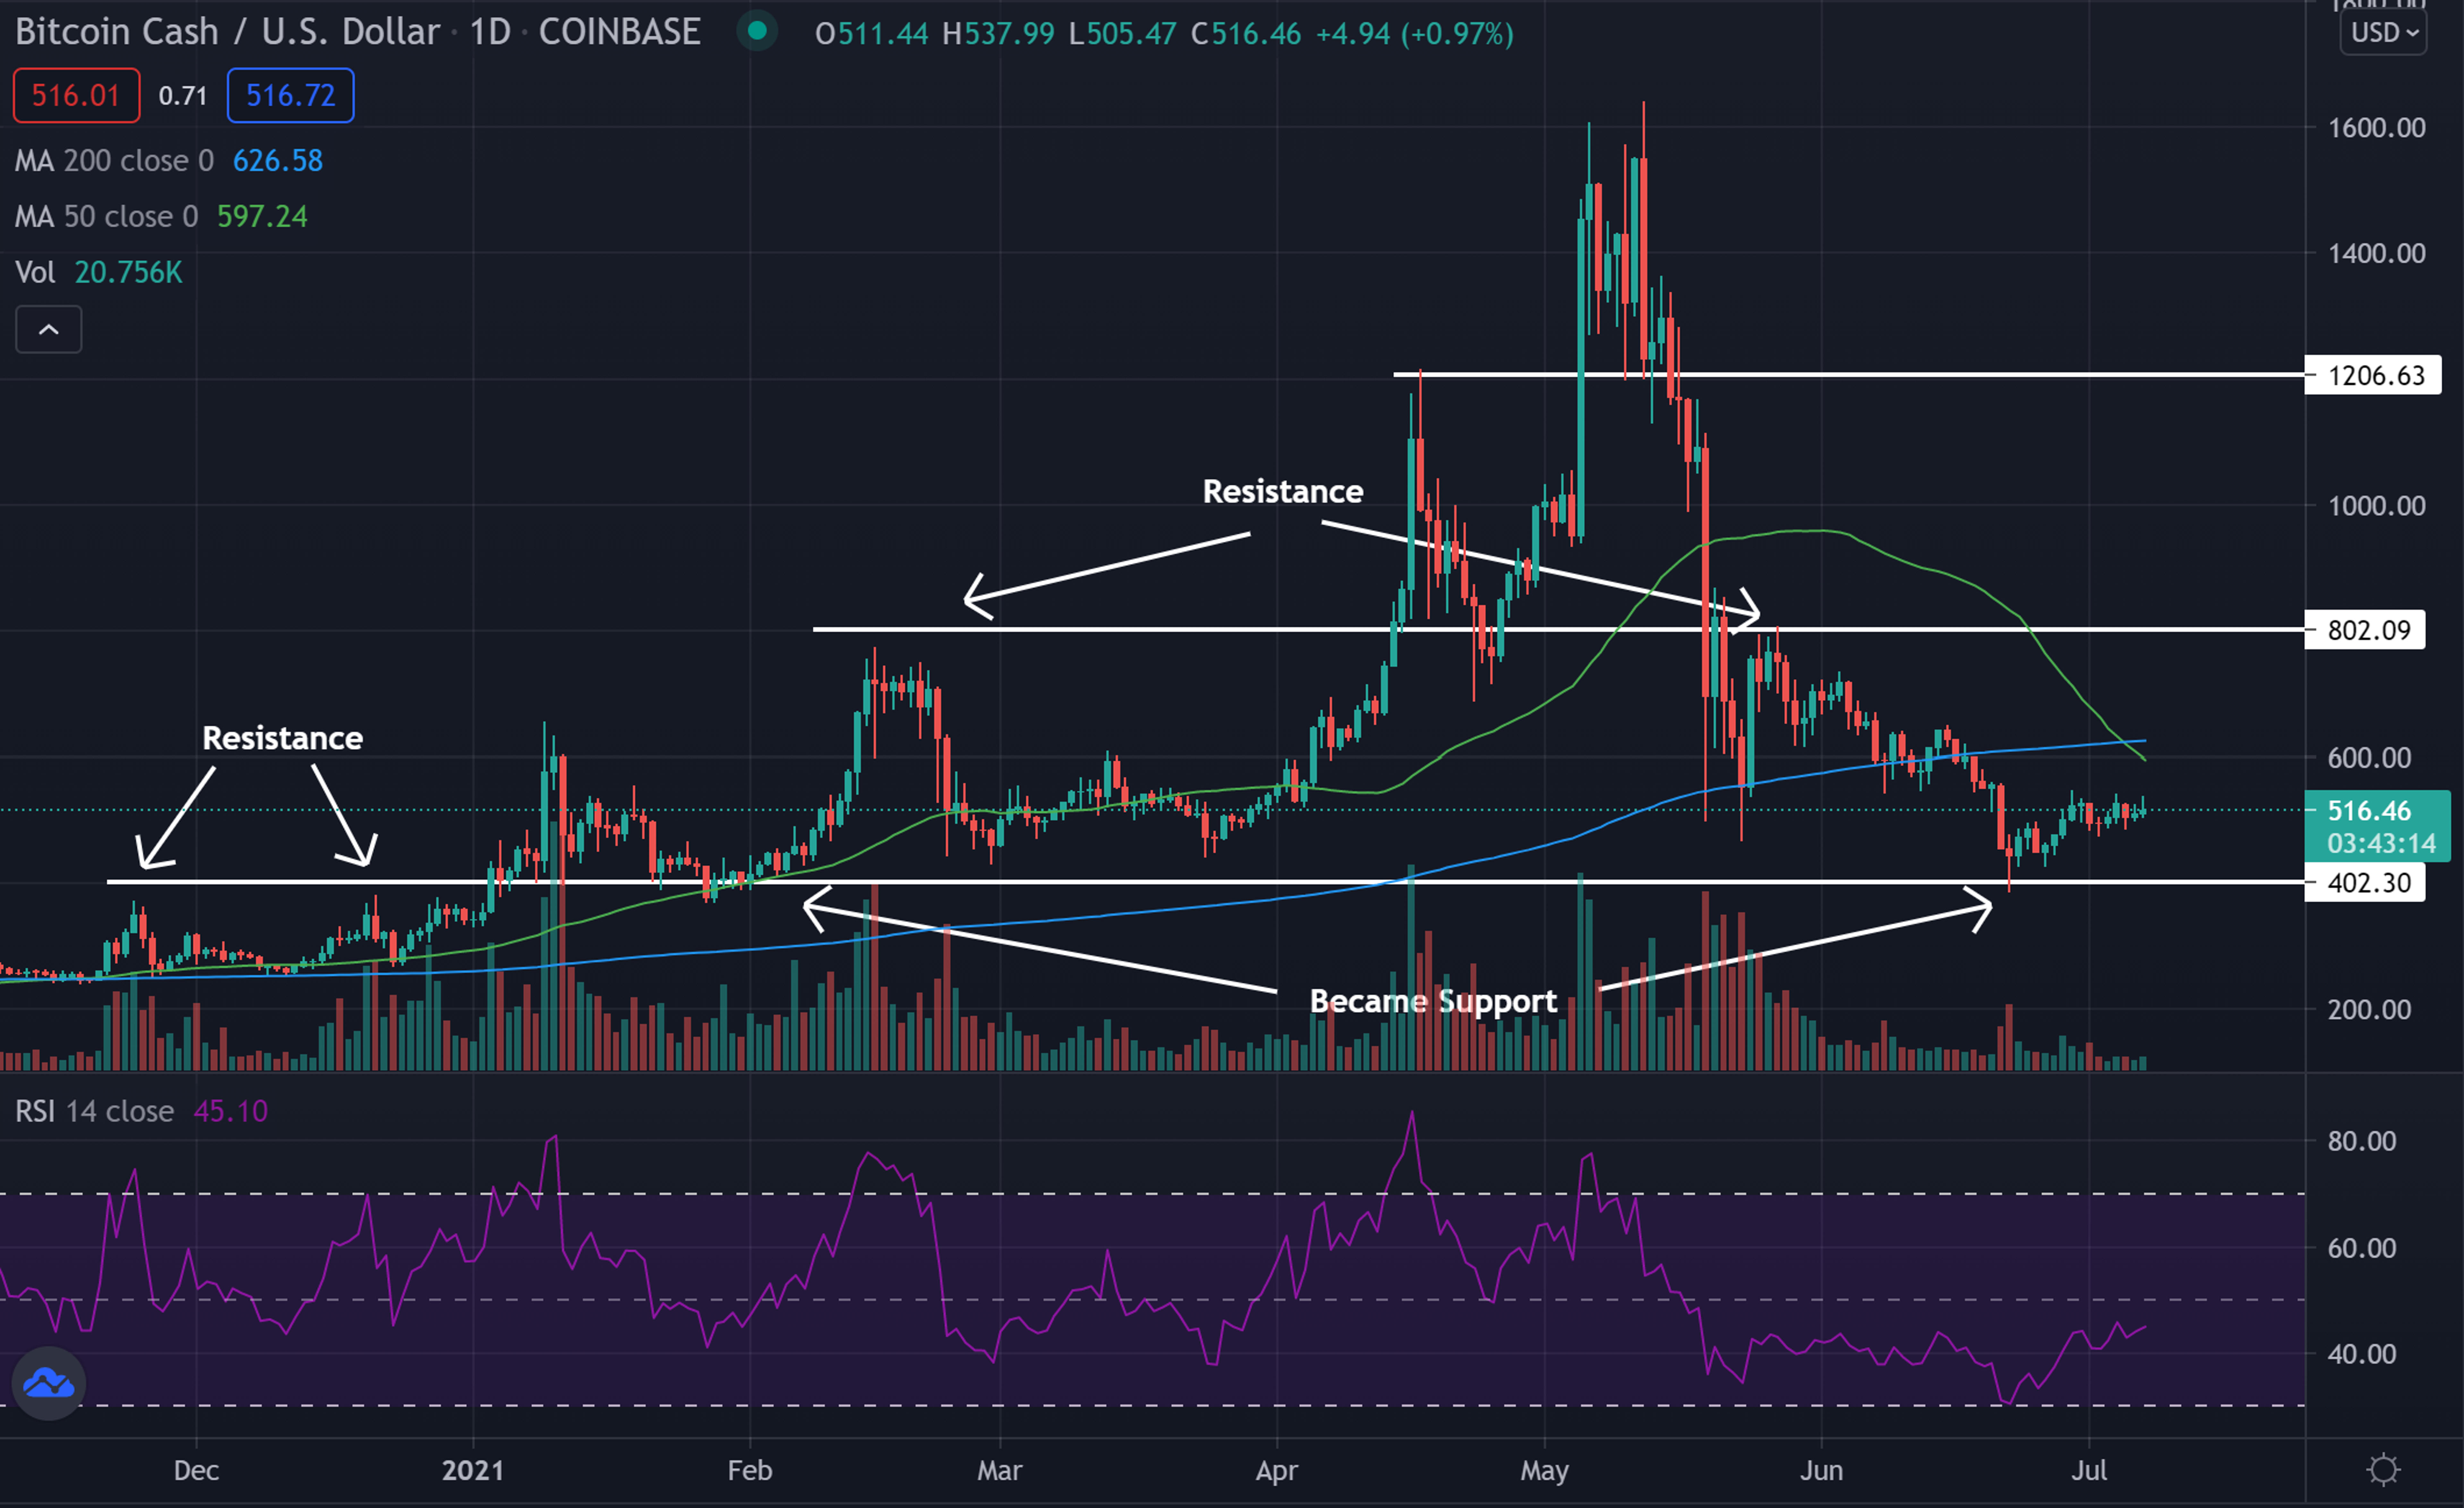
- The Bitcoin Cash chart shows there are three key levels that have held as support and resistance in the past.
- Bitcoin Cash is trading below both the 50-day moving average (green) and the 200-day moving average (blue), indicating the sentiment has likely been bearish.
- Each of these moving averages may act as an area of resistance in the future.
Key Bitcoin Cash Levels To Watch
- The $400, $800, and $1,200 are the key levels shown on the chart above that have acted as support and resistance.
- The $400 level started off as resistance before it was able to cross above the level and then began to hold this area as support. The crypto recently saw a bounce near this level and is heading back up.
- Both the $800 and $1200 levels have acted as resistance for Bitcoin Cash in the past. These levels may continue to hold as resistance until the price can cross above and find support at these levels.
Bitcoin VS Bitcoin Cash In June
Bitcoin opened June 1 at a price of $37,276.23 and closed on June 30 at a price of $35,060, showing a loss of 5.95% for the month of June.
Bitcoin Cash opened June 1 at a price of $702.55 and closed on June 30 at a price of $526.90, showing a loss of 25% for the month of June.
The above calculations show that both cryptos lost ground throughout the month of June, but Bitcoin would have lost less of a percentage for holders.
© 2025 Benzinga.com. Benzinga does not provide investment advice. All rights reserved.
Trade confidently with insights and alerts from analyst ratings, free reports and breaking news that affects the stocks you care about.

