


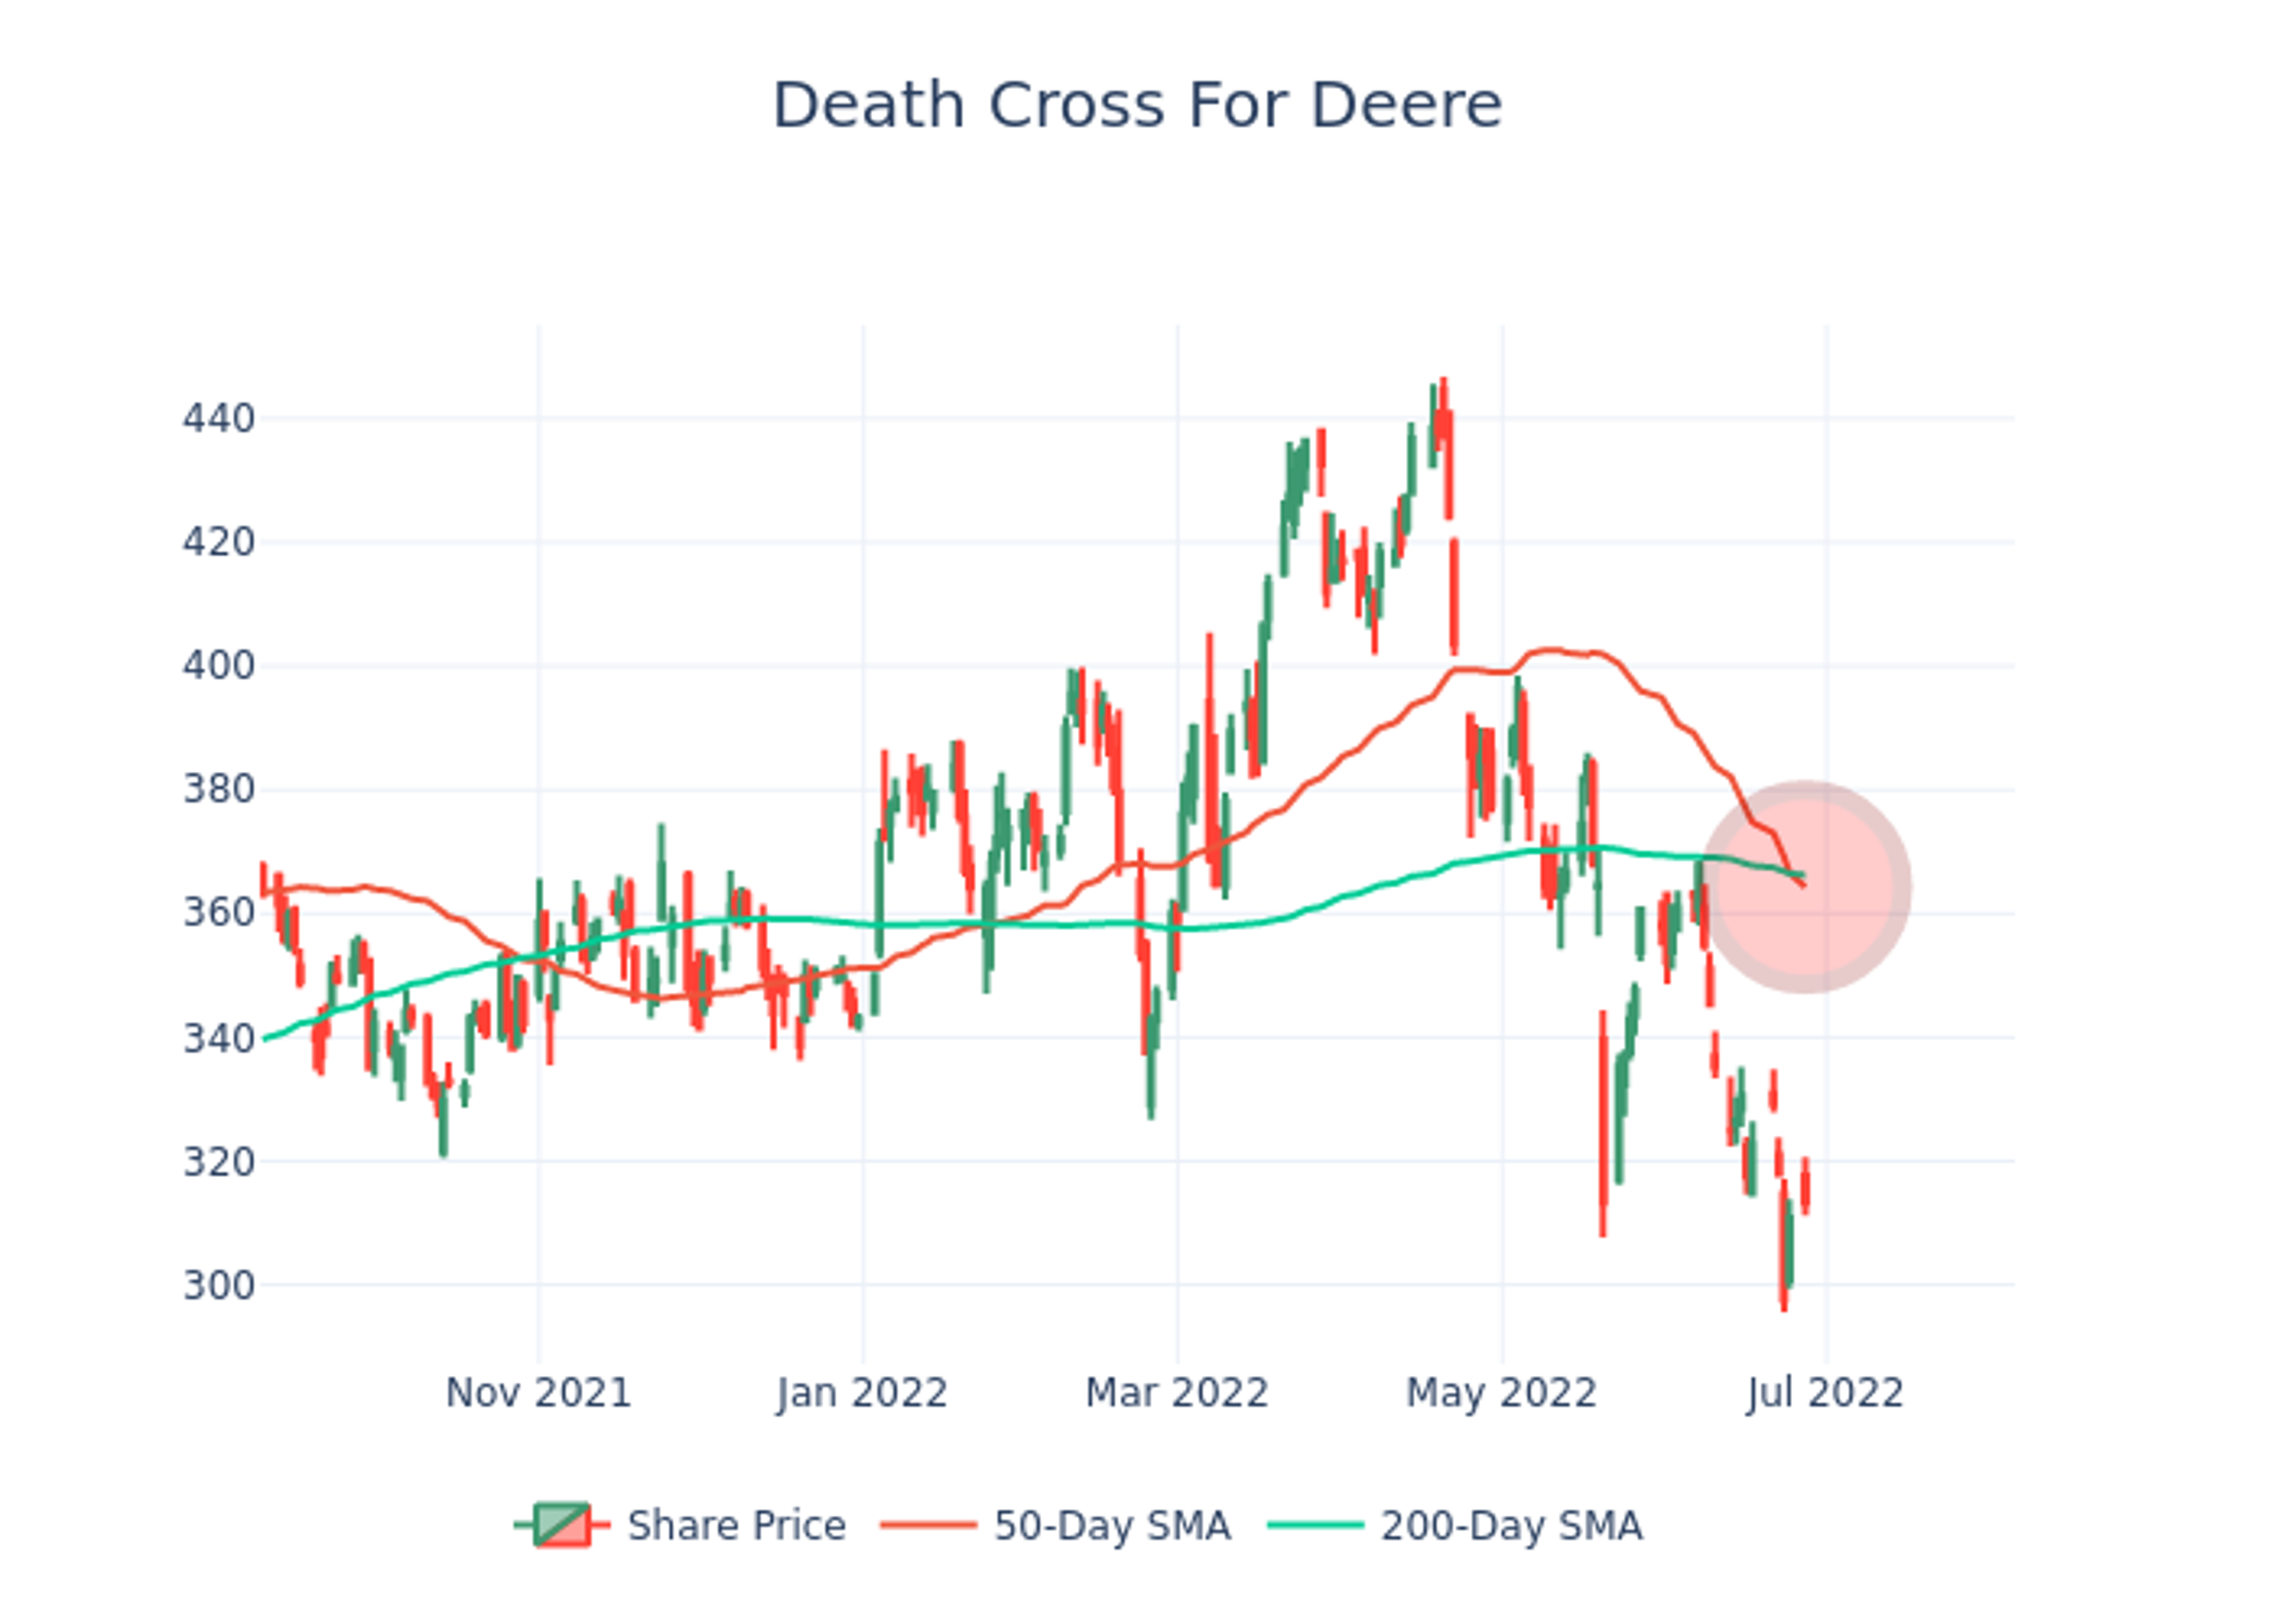
If history is any guide, there may be trouble ahead for shares of Deere DE. A so-called "death cross" has formed on its chart and, not surprisingly, this could be bearish for the stock.
What To Know: Many traders use moving average crossover systems to make their decisions.
When a shorter-term average price crosses above a longer-term average price, it could mean the stock is trending higher. If the short-term average price crosses below the long-term average price, it means the trend is lower.
Why It's Important: The 50-day and the 200-day simple moving averages are commonly used.
The death cross occurs when the 50-day moves below the 200-day. This could mean the long-term trend is changing.
That just happened with Deere, which is trading around $313.28 at publication time.

Remember: Seasoned investors don't blindly trade Death Crosses.


Instead, they use it as a signal to start looking for short positions based on other factors, like price levels and company fundamentals & events.
For seasoned investors, this is just a sign that it might be time to start considering possible short positions.
With that in mind, take a look at Deere's past and upcoming earnings expectations:
| Quarter | Q2 2022 | Q1 2022 | Q4 2021 | Q3 2021 |
|---|---|---|---|---|
| EPS Estimate | 6.71 | 2.26 | 3.90 | 4.57 |
| EPS Actual | 6.81 | 2.92 | 4.12 | 5.25 |
| Revenue Estimate | 13.20B | 8.19B | 10.44B | 10.30B |
| Revenue Actual | 13.37B | 9.57B | 11.33B | 11.53B |
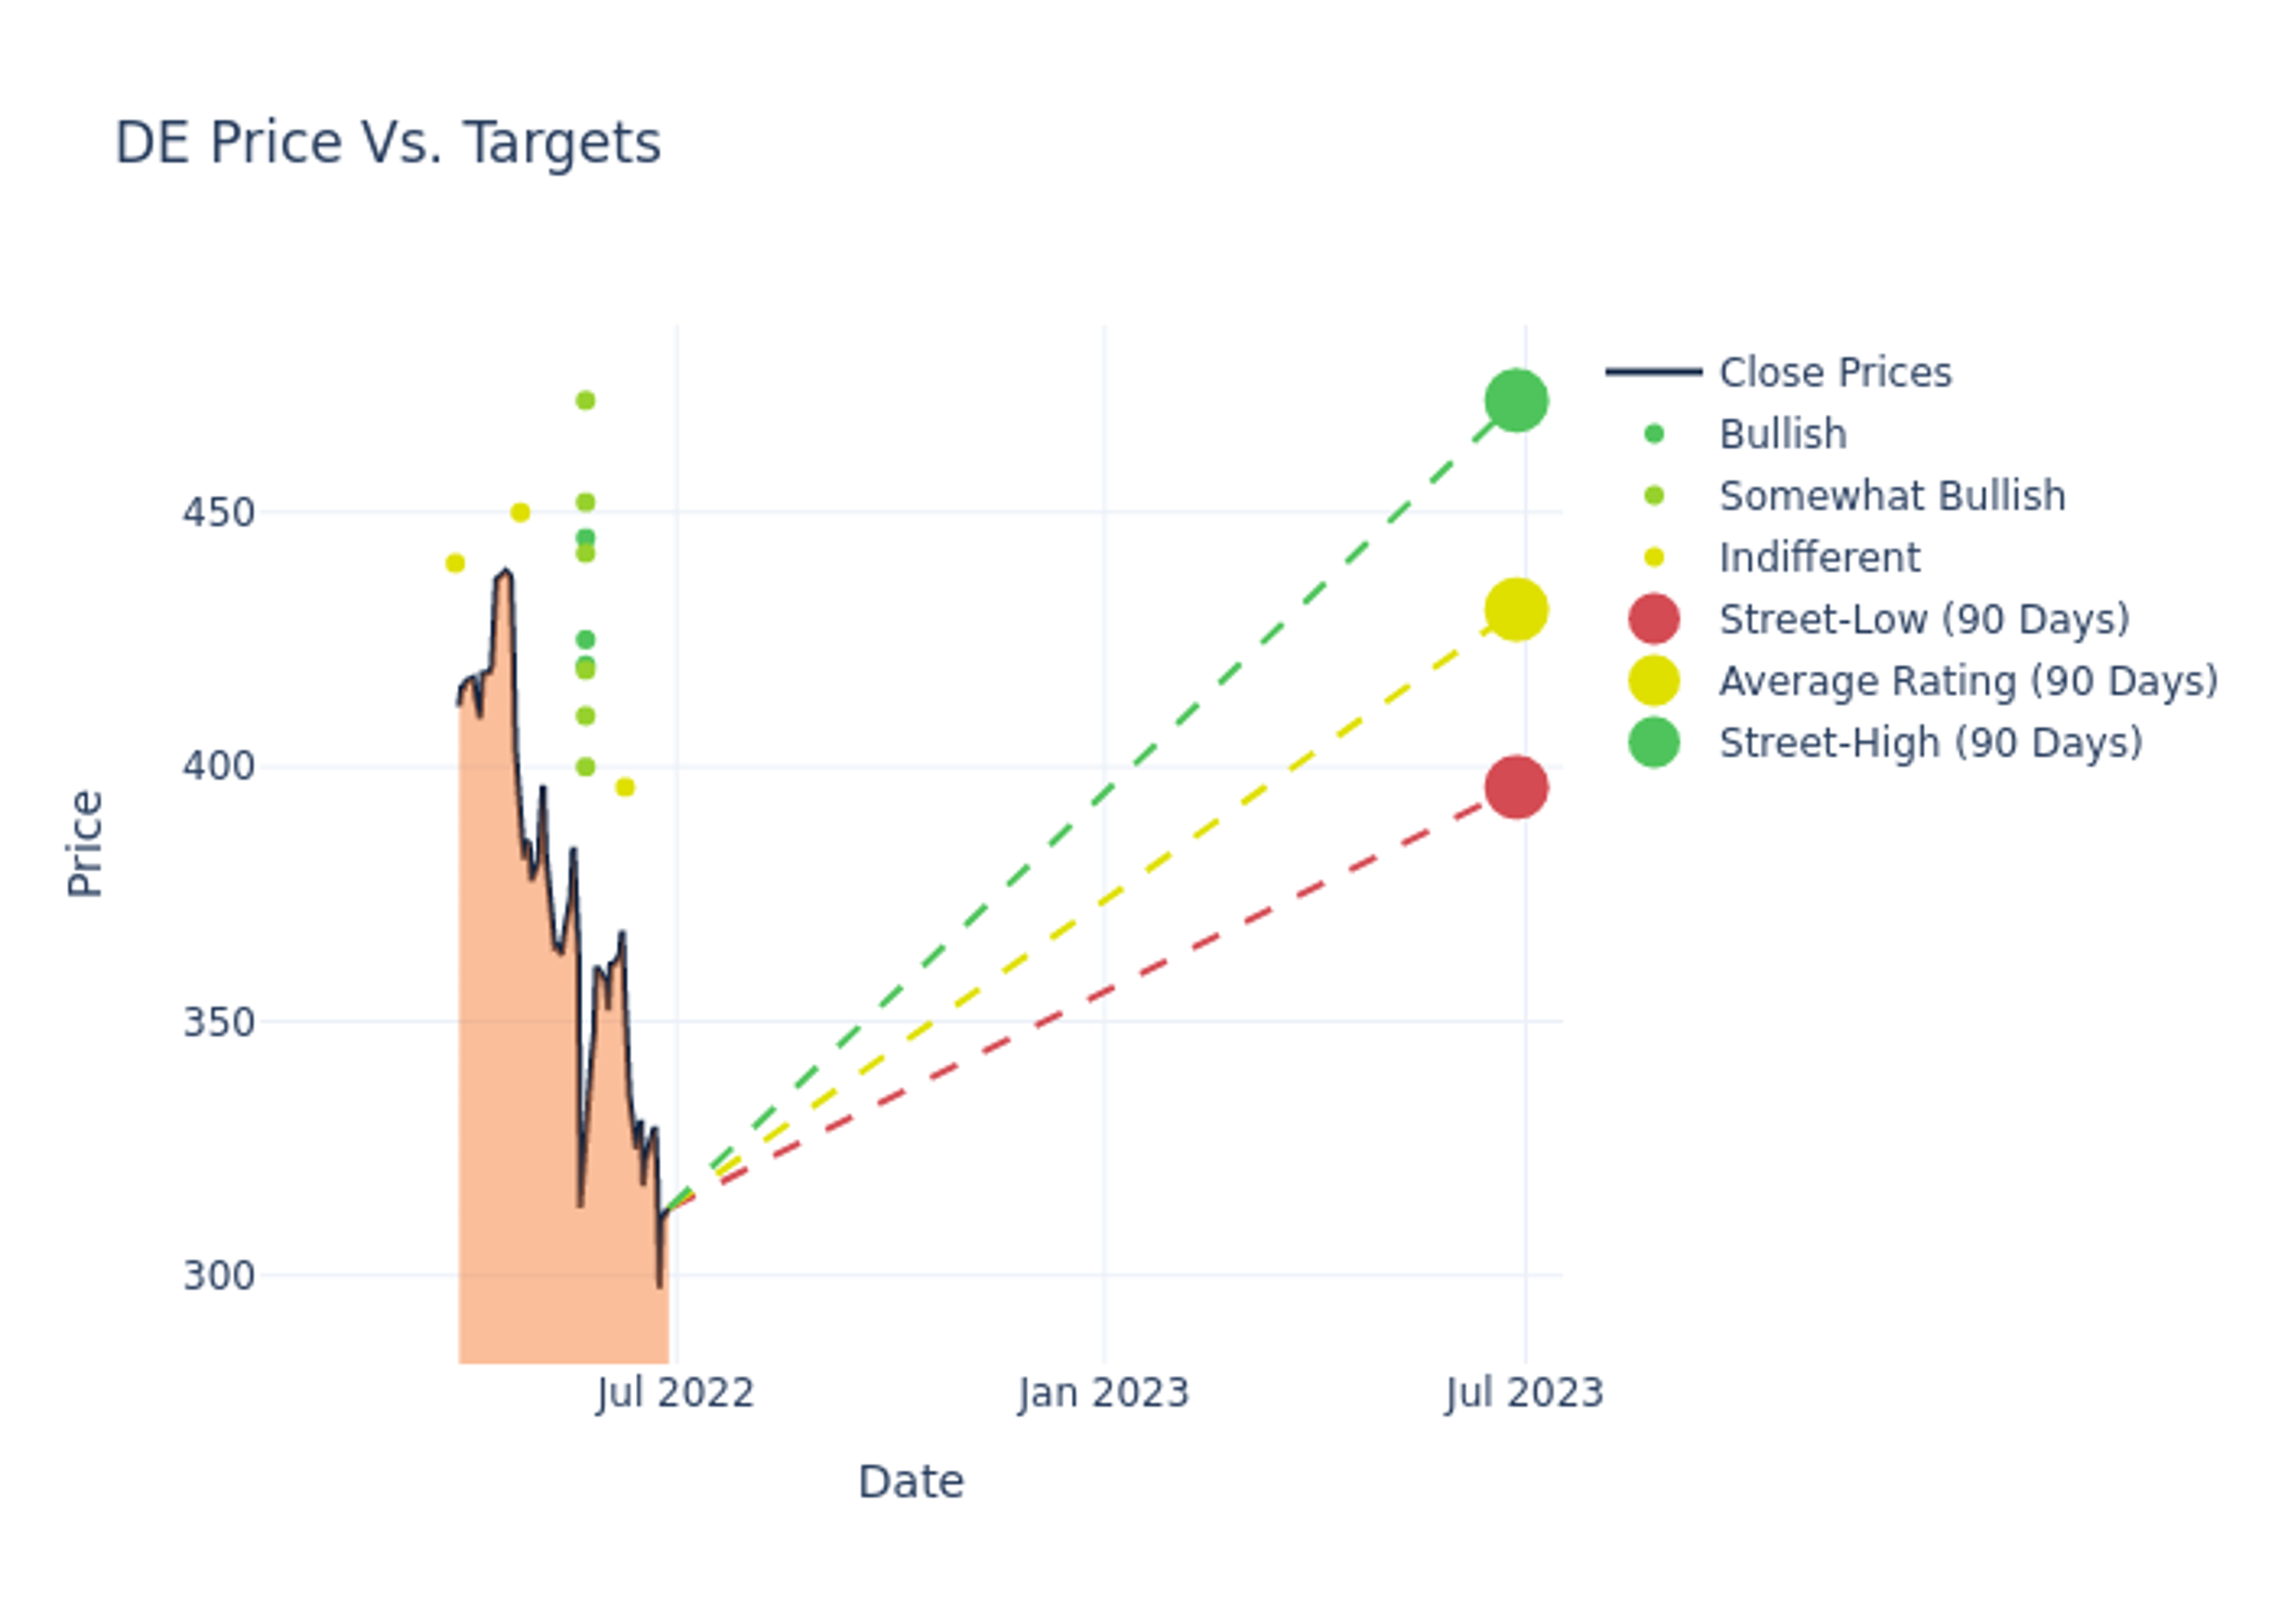
Also consider this overview of Deere analyst ratings:
Do you use the Death Cross signal in your trading or investing? Share this article with a friend if you found it helpful!
This article was generated by Benzinga's automated content engine and reviewed by an editor.
Edge Rankings
Price Trend
© 2025 Benzinga.com. Benzinga does not provide investment advice. All rights reserved.
Trade confidently with insights and alerts from analyst ratings, free reports and breaking news that affects the stocks you care about.

