


In the dynamic and cutthroat world of business, conducting thorough company analysis is essential for investors and industry experts. In this article, we will undertake a comprehensive industry comparison, evaluating Microsoft MSFT and its primary competitors in the Software industry. By closely examining key financial metrics, market position, and growth prospects, our aim is to provide valuable insights for investors and shed light on company's performance within the industry.


Microsoft Background
Microsoft develops and licenses consumer and enterprise software. It is known for its Windows operating systems and Office productivity suite. The company is organized into three equally sized broad segments: productivity and business processes (legacy Microsoft Office, cloud-based Office 365, Exchange, SharePoint, Skype, LinkedIn, Dynamics), intelligence cloud (infrastructure- and platform-as-a-service offerings Azure, Windows Server OS, SQL Server), and more personal computing (Windows Client, Xbox, Bing search, display advertising, and Surface laptops, tablets, and desktops).
| Company | P/E | P/B | P/S | ROE | EBITDA (in billions) | Gross Profit (in billions) | Revenue Growth |
|---|---|---|---|---|---|---|---|
| Microsoft Corp | 37.57 | 12.96 | 13.63 | 9.53% | $33.39 | $42.4 | 17.58% |
| Oracle Corp | 31.43 | 80.90 | 6.18 | 80.28% | $5.16 | $9.2 | 5.43% |
| ServiceNow Inc | 91.88 | 20.79 | 17.73 | 3.98% | $0.51 | $1.92 | 25.62% |
| Palo Alto Networks Inc | 46.79 | 22.41 | 14.12 | 53.52% | $0.21 | $1.48 | 19.33% |
| Gen Digital Inc | 9.88 | 5.75 | 3.71 | 5.96% | $0.47 | $0.77 | 1.6% |
| Dolby Laboratories Inc | 42.89 | 3.36 | 6.29 | 2.85% | $0.09 | $0.28 | -5.78% |
| Qualys Inc | 41.67 | 16.87 | 11.39 | 11.75% | $0.05 | $0.12 | 10.49% |
| Teradata Corp | 63.21 | 27.82 | 2.15 | -5.45% | $0.06 | $0.28 | 1.11% |
| N-able Inc | 102.38 | 3.43 | 5.87 | 1.35% | $0.03 | $0.09 | 0.79% |
| Progress Software Corp | 33.97 | 5.09 | 3.43 | 3.39% | $0.05 | $0.14 | 12.63% |
| Average | 51.57 | 20.71 | 7.87 | 17.51% | $0.74 | $1.59 | 7.91% |
Through a detailed examination of Microsoft, we can deduce the following trends:
-
A Price to Earnings ratio of 37.57 significantly below the industry average by 0.73x suggests undervaluation. This can make the stock appealing for those seeking growth.
-
Considering a Price to Book ratio of 12.96, which is well below the industry average by 0.63x, the stock may be undervalued based on its book value compared to its peers.
-
The Price to Sales ratio of 13.63, which is 1.73x the industry average, suggests the stock could potentially be overvalued in relation to its sales performance compared to its peers.
-
With a Return on Equity (ROE) of 9.53% that is 7.98% below the industry average, it appears that the company exhibits potential inefficiency in utilizing equity to generate profits.
-
The company has higher Earnings Before Interest, Taxes, Depreciation, and Amortization (EBITDA) of $33.39 Billion, which is 45.12x above the industry average, indicating stronger profitability and robust cash flow generation.
-
The gross profit of $42.4 Billion is 26.67x above that of its industry, highlighting stronger profitability and higher earnings from its core operations.
-
The company is experiencing remarkable revenue growth, with a rate of 17.58%, outperforming the industry average of 7.91%.
Debt To Equity Ratio

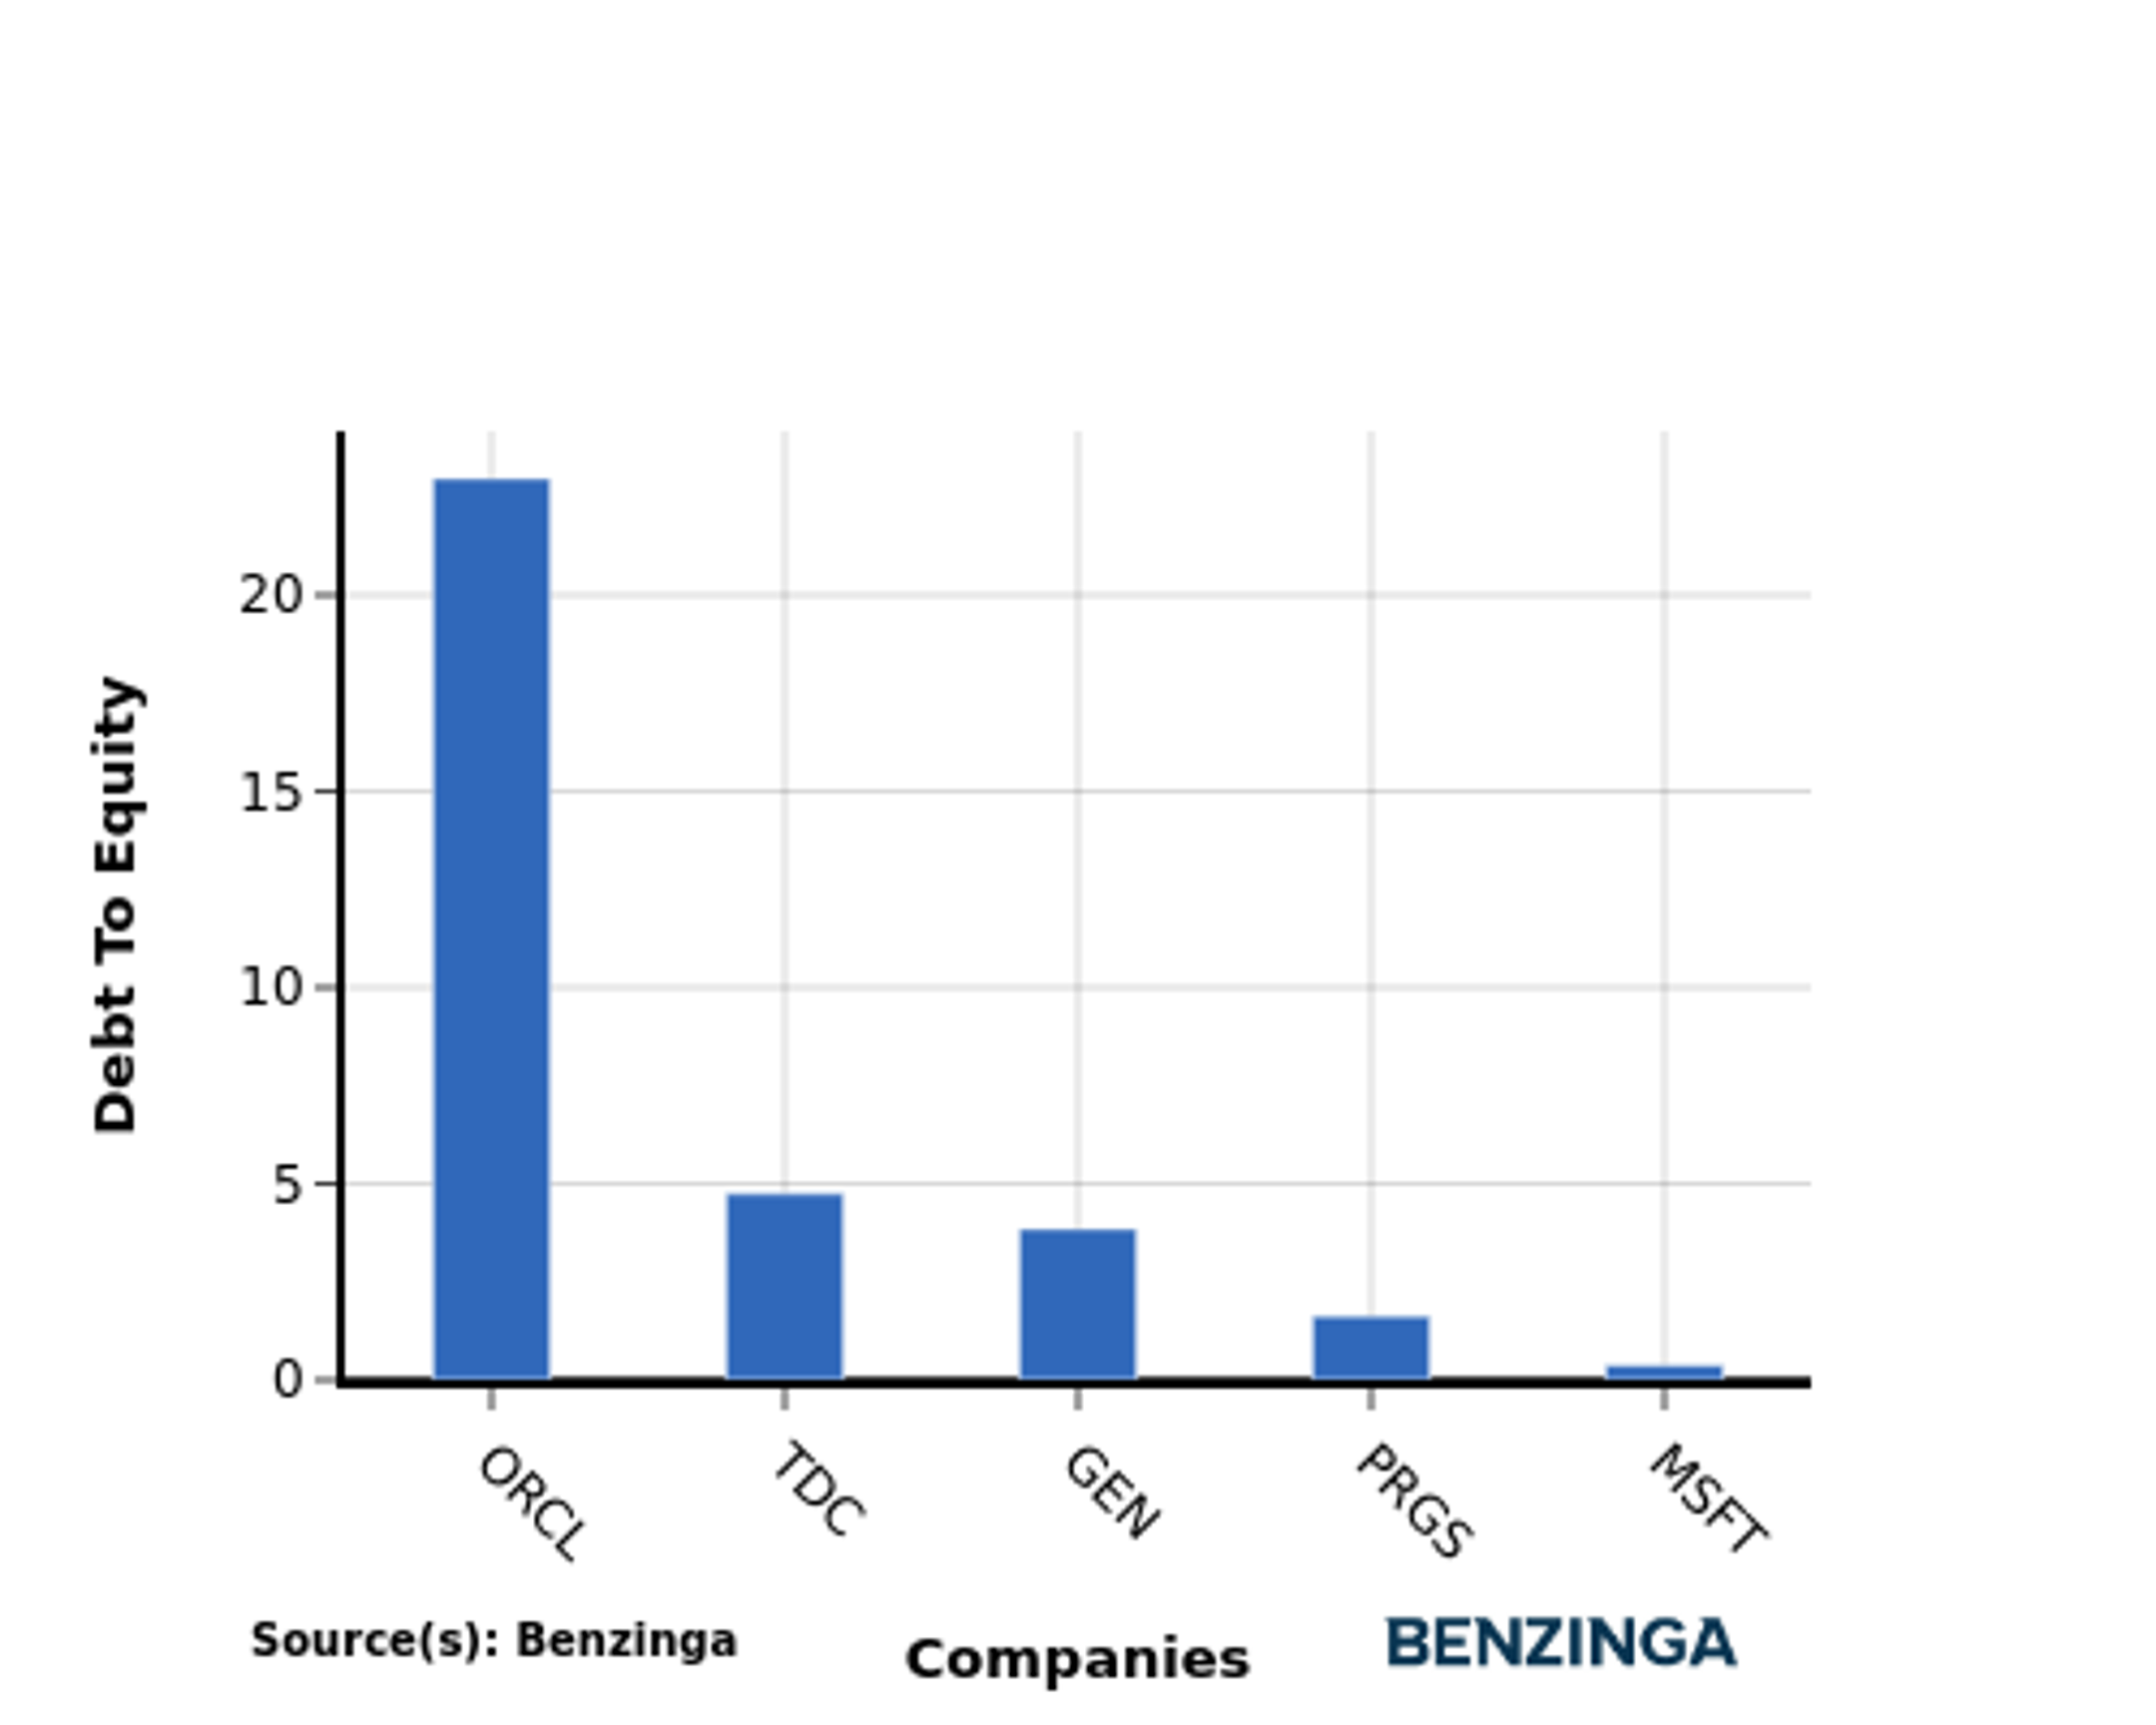
The debt-to-equity (D/E) ratio helps evaluate the capital structure and financial leverage of a company.
Considering the debt-to-equity ratio in industry comparisons allows for a concise evaluation of a company's financial health and risk profile, aiding in informed decision-making.
By evaluating Microsoft against its top 4 peers in terms of the Debt-to-Equity ratio, the following observations arise:
-
Microsoft exhibits a stronger financial position compared to its top 4 peers in the sector, as indicated by its lower debt-to-equity ratio of 0.37.
-
This suggests that the company has a more favorable balance between debt and equity, which can be seen as a positive aspect for investors.
Key Takeaways
For Microsoft in the Software industry, the PE and PB ratios suggest the stock is undervalued compared to peers, indicating potential for growth. However, the high PS ratio implies the stock may be overvalued based on revenue. In terms of ROE, EBITDA, gross profit, and revenue growth, Microsoft shows strong performance, outperforming industry peers and demonstrating solid financial health.
This article was generated by Benzinga's automated content engine and reviewed by an editor.
Edge Rankings
Price Trend
© 2025 Benzinga.com. Benzinga does not provide investment advice. All rights reserved.
Trade confidently with insights and alerts from analyst ratings, free reports and breaking news that affects the stocks you care about.

