


In today's rapidly changing and highly competitive business world, it is vital for investors and industry enthusiasts to carefully assess companies. In this article, we will perform a comprehensive industry comparison, evaluating Palantir Technologies PLTR against its key competitors in the Software industry. By analyzing important financial metrics, market position, and growth prospects, we aim to provide valuable insights for investors and shed light on company's performance within the industry.


Palantir Technologies Background
Palantir is an analytical software company that focuses on leveraging data to create efficiencies in its clients' organizations. The firm serves commercial and government clients via its Foundry and Gotham platforms, respectively. The Denver-based company was founded in 2003 and went public in 2020.
| Company | P/E | P/B | P/S | ROE | EBITDA (in billions) | Gross Profit (in billions) | Revenue Growth |
|---|---|---|---|---|---|---|---|
| Palantir Technologies Inc | 251.43 | 12.01 | 18.50 | 2.33% | $0.09 | $0.45 | 16.8% |
| Adobe Inc | 51.07 | 16.52 | 14.27 | 9.18% | $2.06 | $4.41 | 11.56% |
| Salesforce Inc | 106.58 | 4.67 | 8.13 | 2.11% | $2.42 | $6.57 | 11.27% |
| SAP SE | 81.89 | 4.08 | 5.49 | 3.01% | $2.37 | $5.64 | 3.57% |
| Intuit Inc | 69.07 | 10.39 | 12.09 | 1.41% | $0.53 | $2.22 | 14.67% |
| Synopsys Inc | 68.40 | 13.44 | 14.39 | 5.77% | $0.48 | $1.27 | 24.51% |
| Cadence Design Systems Inc | 84.25 | 25.84 | 20.58 | 8.45% | $0.35 | $0.91 | 13.36% |
| Workday Inc | 1207.83 | 11.51 | 10.89 | 1.76% | $0.23 | $1.42 | 16.67% |
| Roper Technologies Inc | 47.61 | 3.45 | 9.83 | 2.06% | $0.68 | $1.1 | 15.78% |
| Autodesk Inc | 59.15 | 36.20 | 10.16 | 17.93% | $0.37 | $1.29 | 10.47% |
| Ansys Inc | 61.67 | 5.92 | 13.80 | 1.12% | $0.11 | $0.39 | -2.9% |
| Splunk Inc | 222.16 | 129.90 | 6.39 | 121.15% | $0.14 | $0.86 | 14.8% |
| Zoom Video Communications Inc | 91.57 | 2.86 | 4.72 | 1.96% | $0.2 | $0.87 | 3.16% |
| PTC Inc | 85.96 | 7.90 | 10.08 | 1.73% | $0.16 | $0.43 | 7.62% |
| Tyler Technologies Inc | 118.95 | 6.50 | 9.76 | 1.67% | $0.11 | $0.23 | 4.54% |
| Dynatrace Inc | 100.50 | 9.52 | 13.27 | 2.04% | $0.05 | $0.29 | 25.91% |
| Bentley Systems Inc | 92.58 | 21.79 | 14.02 | 7.94% | $0.1 | $0.24 | 14.27% |
| AppLovin Corp | 154.84 | 13.29 | 5.28 | 8.25% | $0.31 | $0.6 | 21.2% |
| Manhattan Associates Inc | 84.68 | 65.75 | 15.83 | 25.97% | $0.05 | $0.13 | 20.36% |
| NICE Ltd | 43.32 | 4.20 | 6.11 | 2.89% | $0.16 | $0.41 | 8.4% |
| Average | 149.06 | 20.72 | 10.79 | 11.92% | $0.57 | $1.54 | 12.59% |
Through a detailed examination of Palantir Technologies, we can deduce the following trends:
-
The current Price to Earnings ratio of 251.43 is 1.69x higher than the industry average, indicating the stock is priced at a premium level according to the market sentiment.
-
The current Price to Book ratio of 12.01, which is 0.58x the industry average, is substantially lower than the industry average, indicating potential undervaluation.
-
With a relatively high Price to Sales ratio of 18.5, which is 1.71x the industry average, the stock might be considered overvalued based on sales performance.
-
The company has a lower Return on Equity (ROE) of 2.33%, which is 9.59% below the industry average. This indicates potential inefficiency in utilizing equity to generate profits, which could be attributed to various factors.
-
Compared to its industry, the company has lower Earnings Before Interest, Taxes, Depreciation, and Amortization (EBITDA) of $90 Million, which is 0.16x below the industry average, potentially indicating lower profitability or financial challenges.
-
With lower gross profit of $450 Million, which indicates 0.29x below the industry average, the company may experience lower revenue after accounting for production costs.
-
The company's revenue growth of 16.8% exceeds the industry average of 12.59%, indicating strong sales performance and market outperformance.
Debt To Equity Ratio

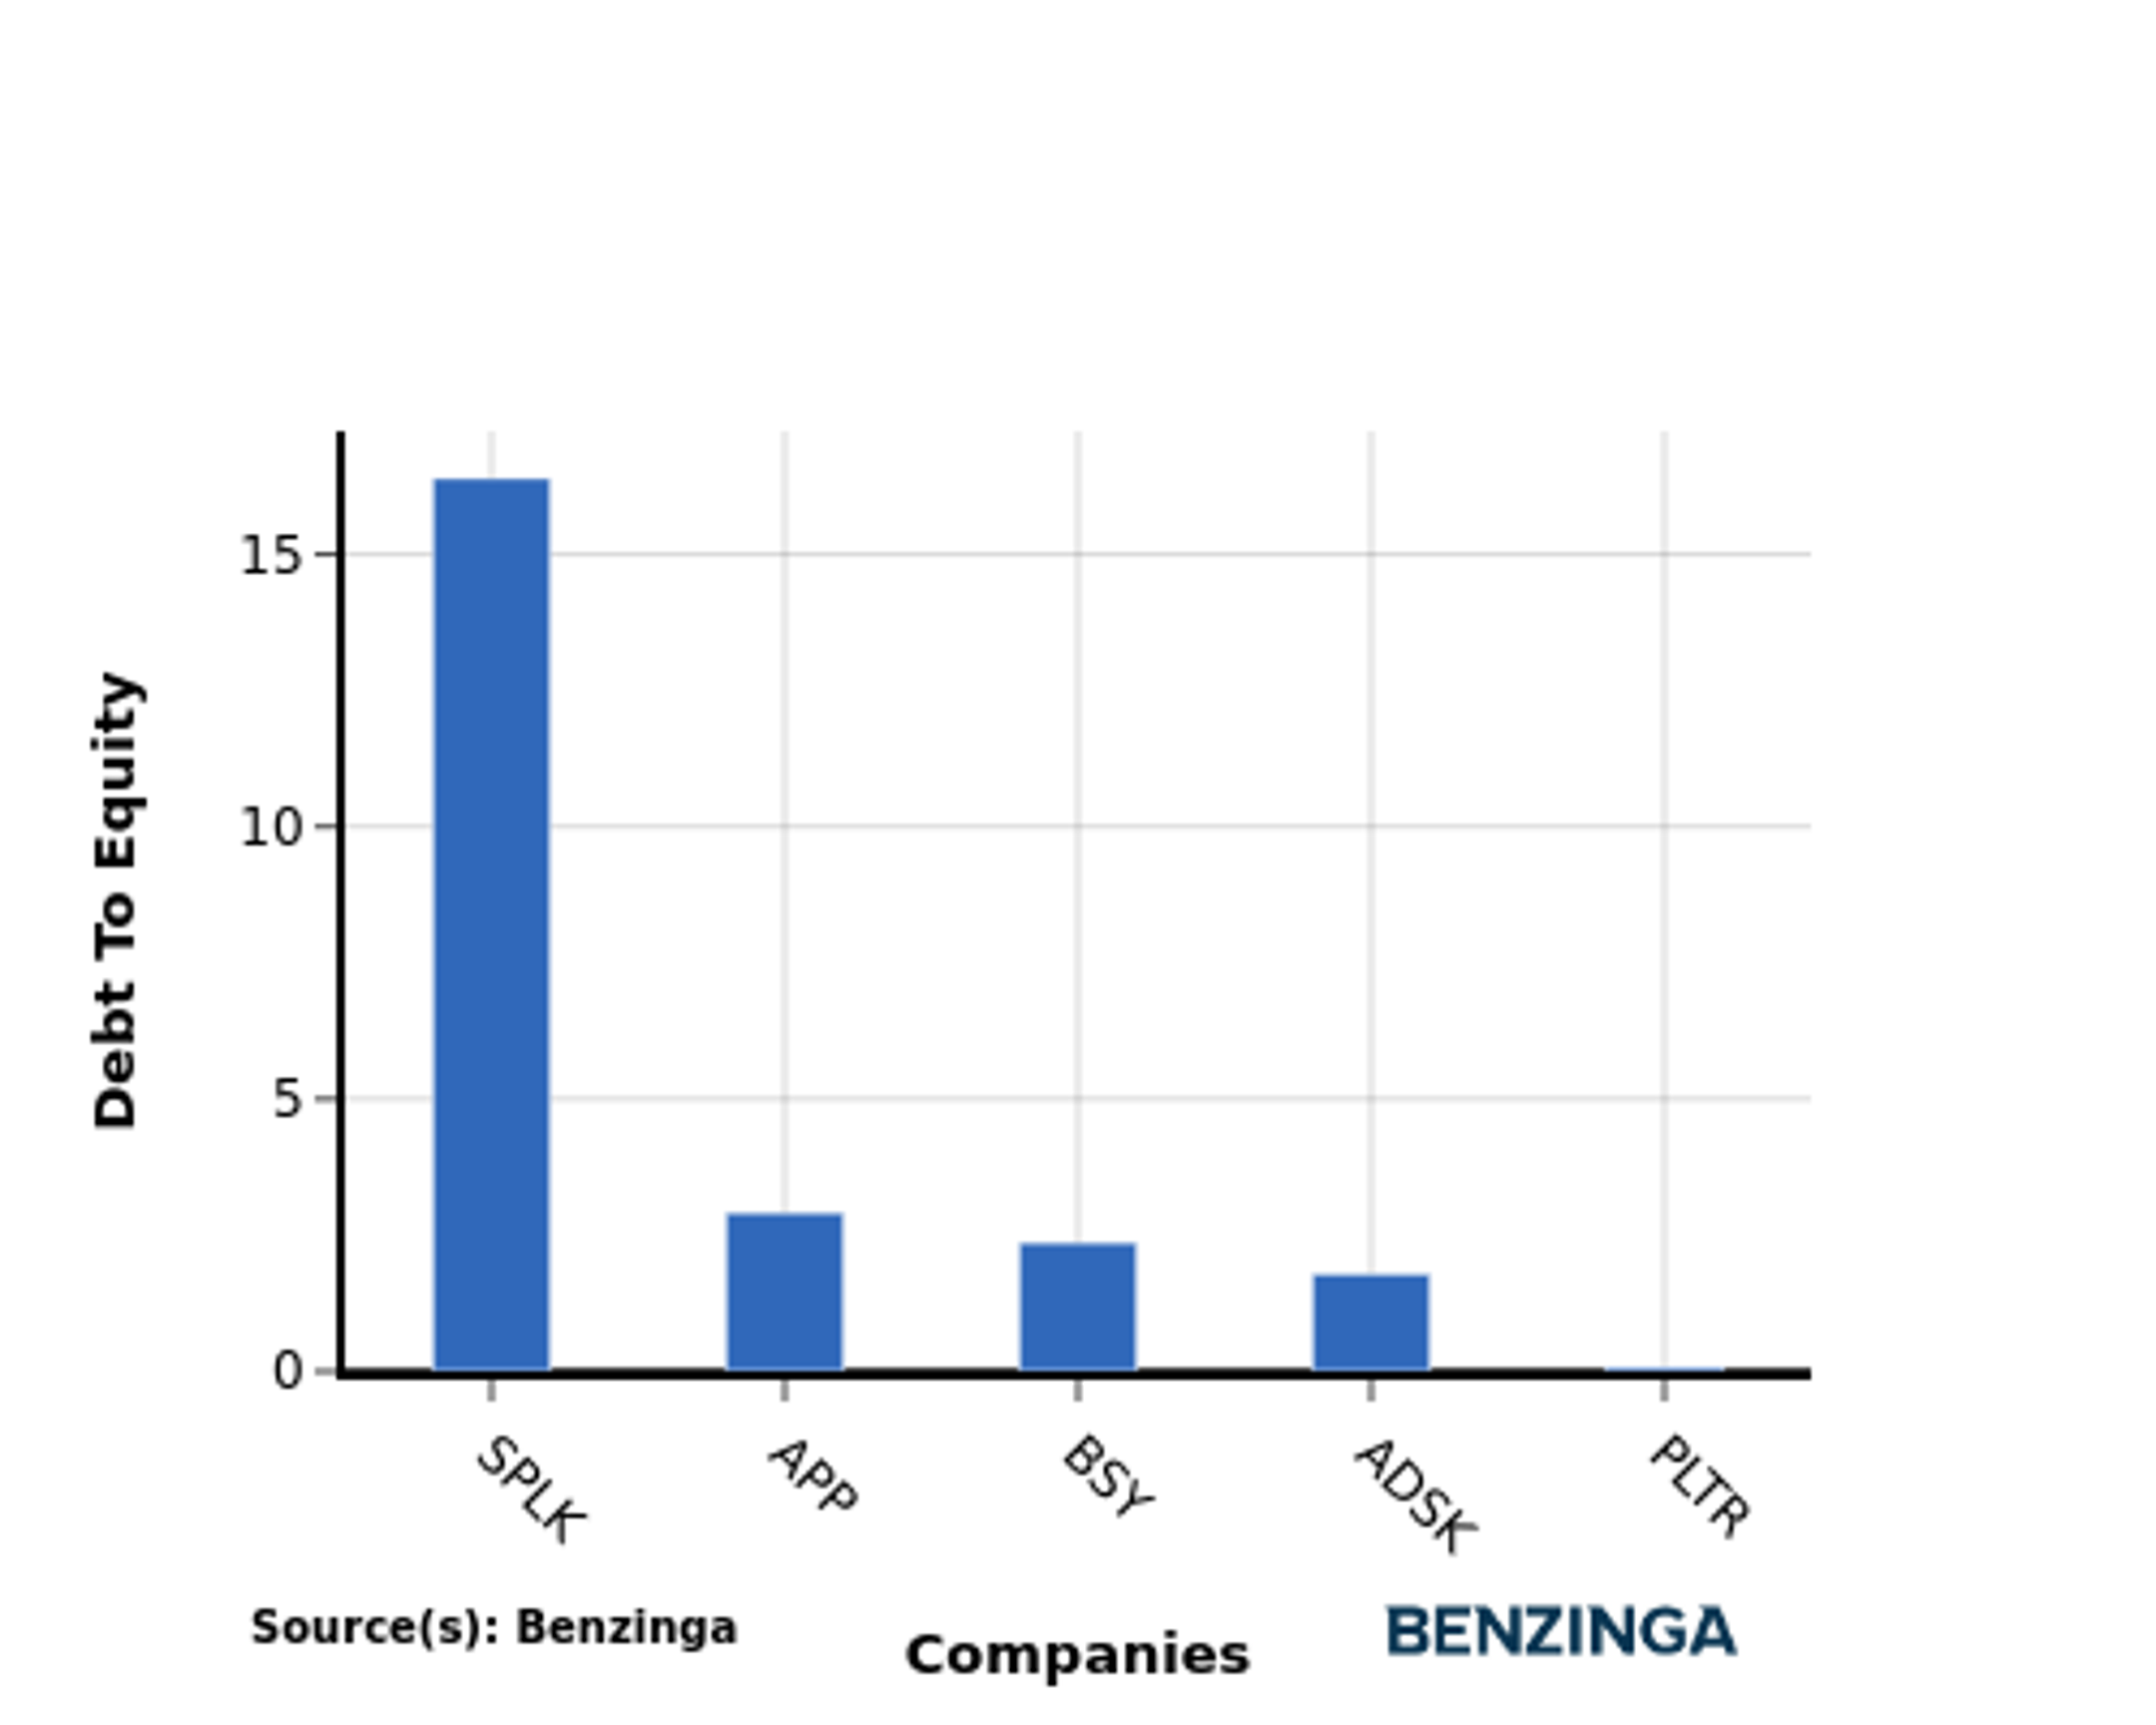
The debt-to-equity (D/E) ratio measures the financial leverage of a company by evaluating its debt relative to its equity.
Considering the debt-to-equity ratio in industry comparisons allows for a concise evaluation of a company's financial health and risk profile, aiding in informed decision-making.
When assessing Palantir Technologies against its top 4 peers using the Debt-to-Equity ratio, the following comparisons can be made:
-
Compared to its top 4 peers, Palantir Technologies has a stronger financial position indicated by its lower debt-to-equity ratio of 0.07.
-
This suggests that the company relies less on debt financing and has a more favorable balance between debt and equity, which can be seen as a positive attribute by investors.
Key Takeaways
The PE, PB, and PS ratios for Palantir Technologies indicate that the company is relatively overvalued compared to its peers in the software industry. The low ROE, EBITDA, and gross profit ratios suggest that Palantir Technologies may be facing challenges in generating profits and managing its expenses. However, the high revenue growth ratio indicates that the company is experiencing strong growth in its top line. Overall, Palantir Technologies' valuation analysis suggests that it may be overvalued compared to its peers, but its high revenue growth is a positive sign for future prospects.
This article was generated by Benzinga's automated content engine and reviewed by an editor.
Edge Rankings
Price Trend
© 2025 Benzinga.com. Benzinga does not provide investment advice. All rights reserved.
Trade confidently with insights and alerts from analyst ratings, free reports and breaking news that affects the stocks you care about.

