

In the preceding three months, 5 analysts have released ratings for Las Vegas Sands (NYSE:LVS), presenting a wide array of perspectives from bullish to bearish.
The following table summarizes their recent ratings, shedding light on the changing sentiments within the past 30 days and comparing them to the preceding months.
| Bullish | Somewhat Bullish | Indifferent | Somewhat Bearish | Bearish | |
|---|---|---|---|---|---|
| Total Ratings | 2 | 3 | 0 | 0 | 0 |
| Last 30D | 1 | 0 | 0 | 0 | 0 |
| 1M Ago | 1 | 2 | 0 | 0 | 0 |
| 2M Ago | 0 | 0 | 0 | 0 | 0 |
| 3M Ago | 0 | 1 | 0 | 0 | 0 |
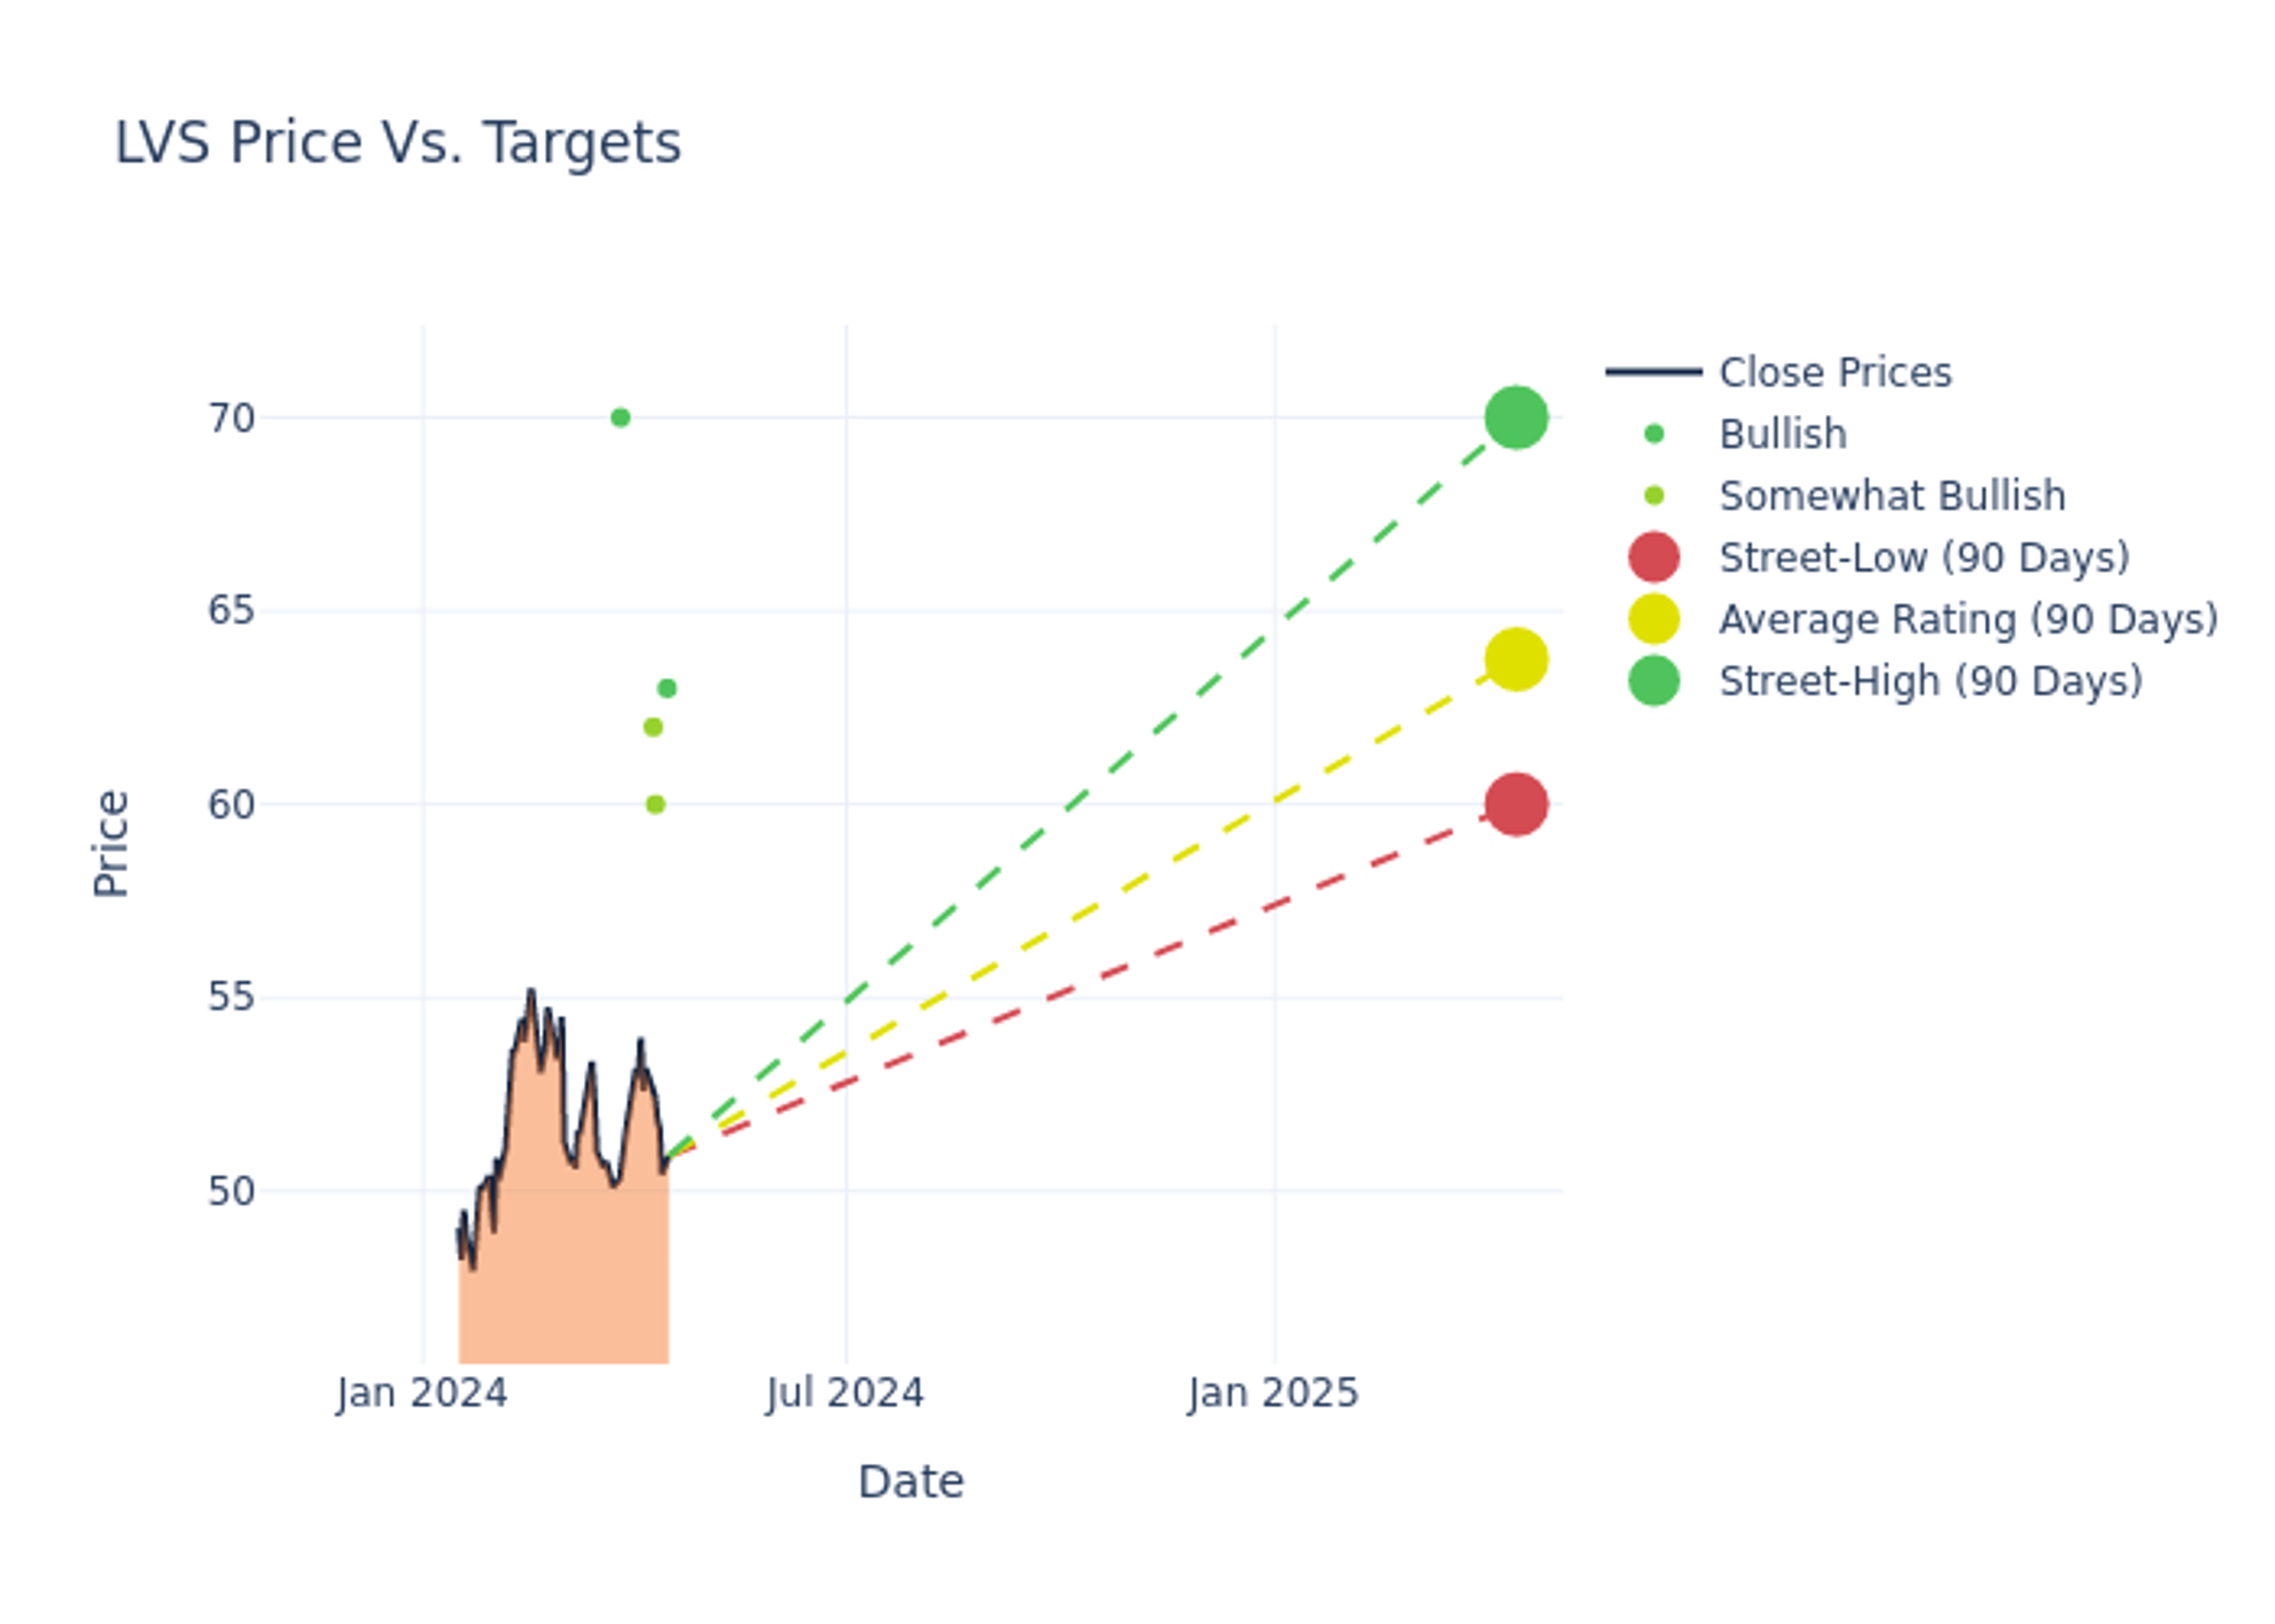
The 12-month price targets assessed by analysts reveal further insights, featuring an average target of $63.2, a high estimate of $70.00, and a low estimate of $60.00. This upward trend is apparent, with the current average reflecting a 7.12% increase from the previous average price target of $59.00.

Decoding Analyst Ratings: A Detailed Look
The standing of Las Vegas Sands among financial experts is revealed through an in-depth exploration of recent analyst actions. The summary below outlines key analysts, their recent evaluations, and adjustments to ratings and price targets.
| Analyst | Analyst Firm | Action Taken | Rating | Current Price Target | Prior Price Target |
|---|---|---|---|---|---|
| Vitaly Umansky | Seaport Global | Announces | Buy | $63.00 | - |
| Brandt Montour | Barclays | Raises | Overweight | $60.00 | $57.00 |
| Stephen Grambling | Morgan Stanley | Raises | Overweight | $62.00 | $61.00 |
| Ben Chaiken | Mizuho | Announces | Buy | $70.00 | - |
| Stephen Grambling | Morgan Stanley | Raises | Overweight | $61.00 | $59.00 |
Key Insights:
- Action Taken: Analysts frequently update their recommendations based on evolving market conditions and company performance. Whether they 'Maintain', 'Raise' or 'Lower' their stance, it reflects their reaction to recent developments related to Las Vegas Sands. This information provides a snapshot of how analysts perceive the current state of the company.
- Rating: Analyzing trends, analysts offer qualitative evaluations, ranging from 'Outperform' to 'Underperform'. These ratings convey expectations for the relative performance of Las Vegas Sands compared to the broader market.
- Price Targets: Analysts gauge the dynamics of price targets, providing estimates for the future value of Las Vegas Sands's stock. This comparison reveals trends in analysts' expectations over time.
Understanding these analyst evaluations alongside key financial indicators can offer valuable insights into Las Vegas Sands's market standing. Stay informed and make well-considered decisions with our Ratings Table.
Stay up to date on Las Vegas Sands analyst ratings.
About Las Vegas Sands
Las Vegas Sands is the world's largest operator of fully integrated resorts, featuring casino, hotel, entertainment, food and beverage, retail, and convention center operations. The company owns the Venetian Macao, Sands Macao, Londoner Macao, Four Seasons Hotel Macao, and Parisian Macao, as well as the Marina Bay Sands resort in Singapore. We expect Sands to open a fourth tower in Singapore toward the end of 2028. Its Venetian and Palazzo Las Vegas assets in the U.S. were sold to Apollo and VICI in 2022. With the sale of its Vegas assets, the company generates all its EBITDA from Asia, with its casino operations generating the majority of sales.
Understanding the Numbers: Las Vegas Sands's Finances
Market Capitalization: Boasting an elevated market capitalization, the company surpasses industry averages. This signals substantial size and strong market recognition.
Positive Revenue Trend: Examining Las Vegas Sands's financials over 3 months reveals a positive narrative. The company achieved a noteworthy revenue growth rate of 160.97% as of 31 December, 2023, showcasing a substantial increase in top-line earnings. As compared to competitors, the company surpassed expectations with a growth rate higher than the average among peers in the Consumer Discretionary sector.
Net Margin: Las Vegas Sands's net margin excels beyond industry benchmarks, reaching 13.1%. This signifies efficient cost management and strong financial health.
Return on Equity (ROE): Las Vegas Sands's financial strength is reflected in its exceptional ROE, which exceeds industry averages. With a remarkable ROE of 8.81%, the company showcases efficient use of equity capital and strong financial health.
Return on Assets (ROA): Las Vegas Sands's financial strength is reflected in its exceptional ROA, which exceeds industry averages. With a remarkable ROA of 1.74%, the company showcases efficient use of assets and strong financial health.
Debt Management: Las Vegas Sands's debt-to-equity ratio is below the industry average at 3.41, reflecting a lower dependency on debt financing and a more conservative financial approach.
Understanding the Relevance of Analyst Ratings
Ratings come from analysts, or specialists within banking and financial systems that report for specific stocks or defined sectors (typically once per quarter for each stock). Analysts usually derive their information from company conference calls and meetings, financial statements, and conversations with important insiders to reach their decisions.
Some analysts will also offer forecasts for metrics like growth estimates, earnings, and revenue to provide further guidance on stocks. Investors who use analyst ratings should note that this specialized advice comes from humans and may be subject to error.
This article was generated by Benzinga's automated content engine and reviewed by an editor.
© 2025 Benzinga.com. Benzinga does not provide investment advice. All rights reserved.