

Analysts' ratings for Olin (NYSE:OLN) over the last quarter vary from bullish to bearish, as provided by 9 analysts.
The table below provides a snapshot of their recent ratings, showcasing how sentiments have evolved over the past 30 days and comparing them to the preceding months.
| Bullish | Somewhat Bullish | Indifferent | Somewhat Bearish | Bearish | |
|---|---|---|---|---|---|
| Total Ratings | 1 | 2 | 6 | 0 | 0 |
| Last 30D | 0 | 0 | 1 | 0 | 0 |
| 1M Ago | 0 | 0 | 0 | 0 | 0 |
| 2M Ago | 0 | 0 | 0 | 0 | 0 |
| 3M Ago | 1 | 2 | 5 | 0 | 0 |
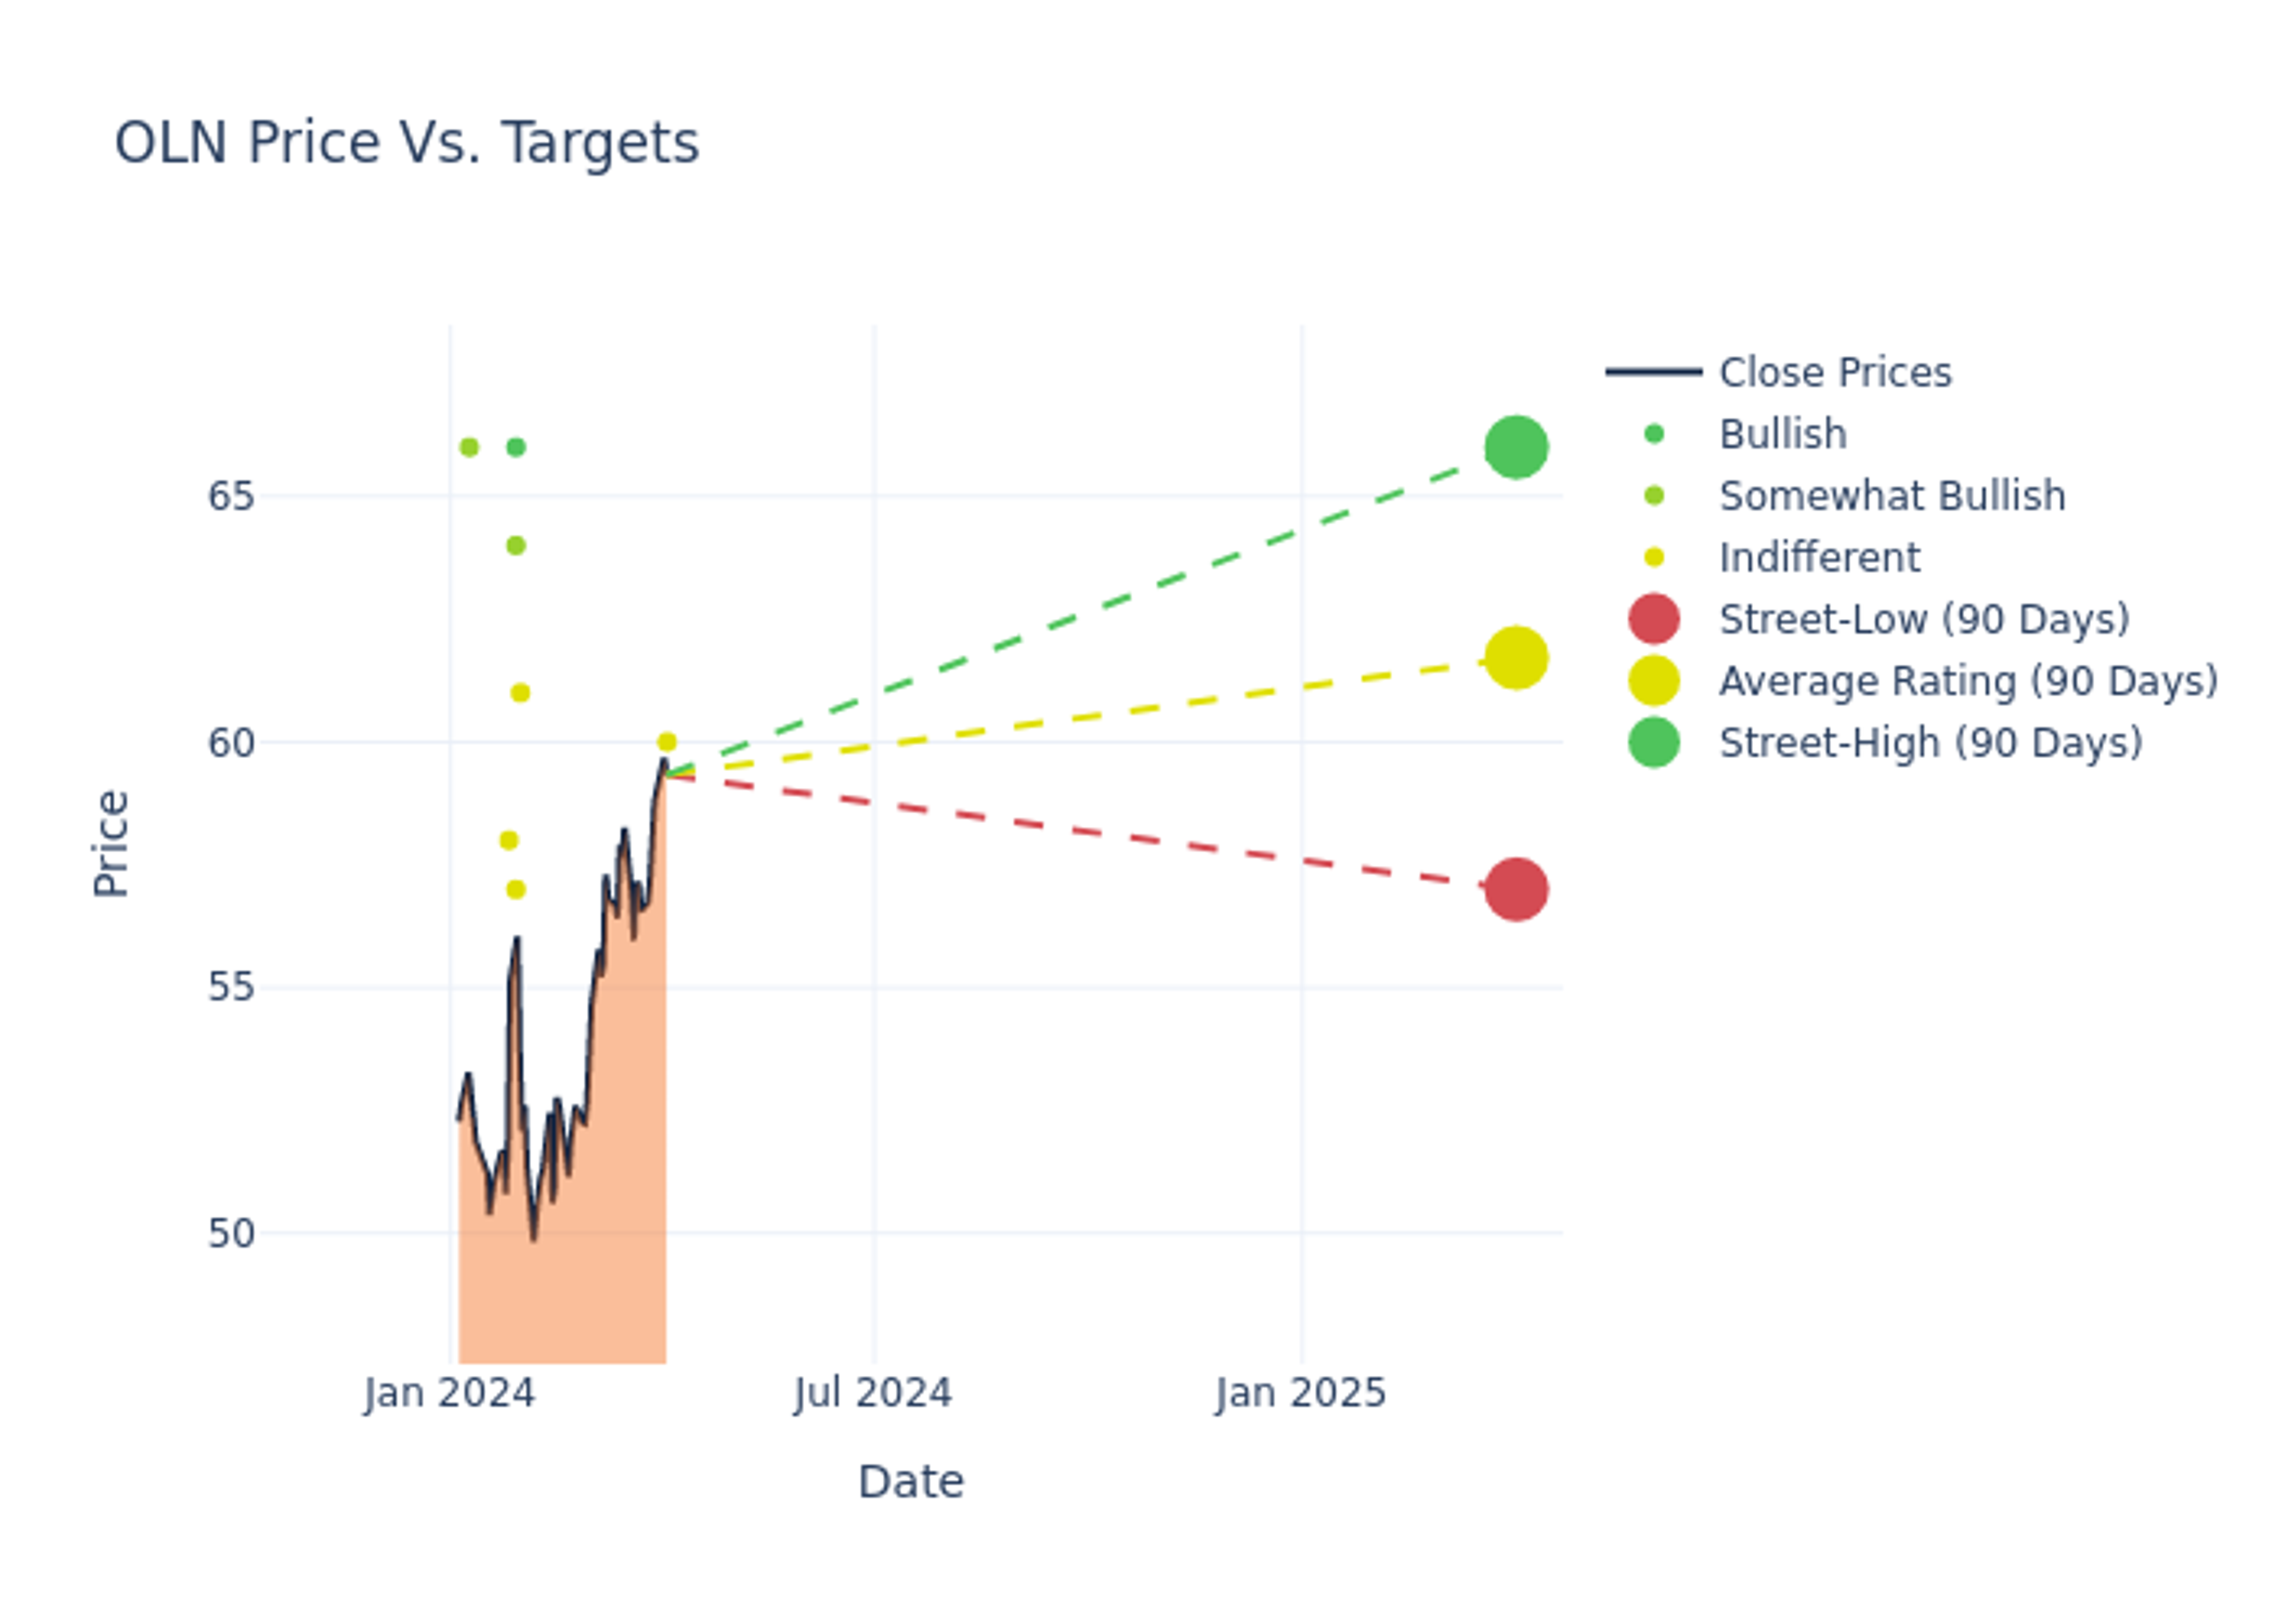
Analysts provide deeper insights through their assessments of 12-month price targets, revealing an average target of $61.0, a high estimate of $66.00, and a low estimate of $56.00. This upward trend is evident, with the current average reflecting a 8.08% increase from the previous average price target of $56.44.

Exploring Analyst Ratings: An In-Depth Overview
The standing of Olin among financial experts is revealed through an in-depth exploration of recent analyst actions. The summary below outlines key analysts, their recent evaluations, and adjustments to ratings and price targets.
| Analyst | Analyst Firm | Action Taken | Rating | Current Price Target | Prior Price Target |
|---|---|---|---|---|---|
| Michael Sison | Wells Fargo | Raises | Equal-Weight | $60.00 | $56.00 |
| Duffy Fischer | Goldman Sachs | Raises | Neutral | $61.00 | $55.00 |
| Duffy Fischer | Goldman Sachs | Raises | Neutral | $61.00 | $55.00 |
| Michael Leithead | Barclays | Raises | Equal-Weight | $57.00 | $49.00 |
| Arun Viswanathan | RBC Capital | Raises | Outperform | $64.00 | $58.00 |
| Vincent Anderson | Stifel | Raises | Buy | $66.00 | $65.00 |
| Joshua Spector | UBS | Raises | Neutral | $58.00 | $56.00 |
| Joshua Spector | UBS | Raises | Neutral | $56.00 | $53.00 |
| Aleksey Yefremov | Keybanc | Raises | Overweight | $66.00 | $61.00 |
Key Insights:
- Action Taken: Analysts frequently update their recommendations based on evolving market conditions and company performance. Whether they 'Maintain', 'Raise' or 'Lower' their stance, it reflects their reaction to recent developments related to Olin. This information provides a snapshot of how analysts perceive the current state of the company.
- Rating: Providing a comprehensive analysis, analysts offer qualitative assessments, ranging from 'Outperform' to 'Underperform'. These ratings reflect expectations for the relative performance of Olin compared to the broader market.
- Price Targets: Analysts predict movements in price targets, offering estimates for Olin's future value. Examining the current and prior targets offers insights into analysts' evolving expectations.
Navigating through these analyst evaluations alongside other financial indicators can contribute to a holistic understanding of Olin's market standing. Stay informed and make data-driven decisions with our Ratings Table.
Stay up to date on Olin analyst ratings.
Unveiling the Story Behind Olin
Olin Corp manufactures and sells a variety of chemicals and chemical-based products. The company organizes itself into three segments based on the product type. The Chlor alkali products and Vinyls segment, which generates the majority of revenue, sells chlorine and caustic soda, which are used in a variety of industries including cosmetics, textiles, crop protection, and fire protection products. The Epoxy segment sells epoxy resins used in paints and coatings. The Winchester segment sells sporting ammunition and ammunition accessories under the Winchester brand. The majority of revenue comes from the United States.
Olin: Delving into Financials
Market Capitalization Analysis: With an elevated market capitalization, the company stands out above industry averages, showcasing substantial size and market acknowledgment.
Negative Revenue Trend: Examining Olin's financials over 3 months reveals challenges. As of 31 December, 2023, the company experienced a decline of approximately -18.33% in revenue growth, reflecting a decrease in top-line earnings. In comparison to its industry peers, the company trails behind with a growth rate lower than the average among peers in the Materials sector.
Net Margin: Olin's net margin excels beyond industry benchmarks, reaching 3.28%. This signifies efficient cost management and strong financial health.
Return on Equity (ROE): Olin's ROE excels beyond industry benchmarks, reaching 2.32%. This signifies robust financial management and efficient use of shareholder equity capital.
Return on Assets (ROA): Olin's ROA stands out, surpassing industry averages. With an impressive ROA of 0.68%, the company demonstrates effective utilization of assets and strong financial performance.
Debt Management: Olin's debt-to-equity ratio is below industry norms, indicating a sound financial structure with a ratio of 1.35.
Analyst Ratings: Simplified
Analysts are specialists within banking and financial systems that typically report for specific stocks or within defined sectors. These people research company financial statements, sit in conference calls and meetings, and speak with relevant insiders to determine what are known as analyst ratings for stocks. Typically, analysts will rate each stock once a quarter.
Analysts may supplement their ratings with predictions for metrics like growth estimates, earnings, and revenue, offering investors a more comprehensive outlook. However, investors should be mindful that analysts, like any human, can have subjective perspectives influencing their forecasts.
This article was generated by Benzinga's automated content engine and reviewed by an editor.
© 2025 Benzinga.com. Benzinga does not provide investment advice. All rights reserved.