

4 analysts have shared their evaluations of Blue Owl Cap (NYSE:OWL) during the recent three months, expressing a mix of bullish and bearish perspectives.
The table below offers a condensed view of their recent ratings, showcasing the changing sentiments over the past 30 days and comparing them to the preceding months.
| Bullish | Somewhat Bullish | Indifferent | Somewhat Bearish | Bearish | |
|---|---|---|---|---|---|
| Total Ratings | 2 | 2 | 0 | 0 | 0 |
| Last 30D | 1 | 0 | 0 | 0 | 0 |
| 1M Ago | 0 | 0 | 0 | 0 | 0 |
| 2M Ago | 1 | 1 | 0 | 0 | 0 |
| 3M Ago | 0 | 1 | 0 | 0 | 0 |
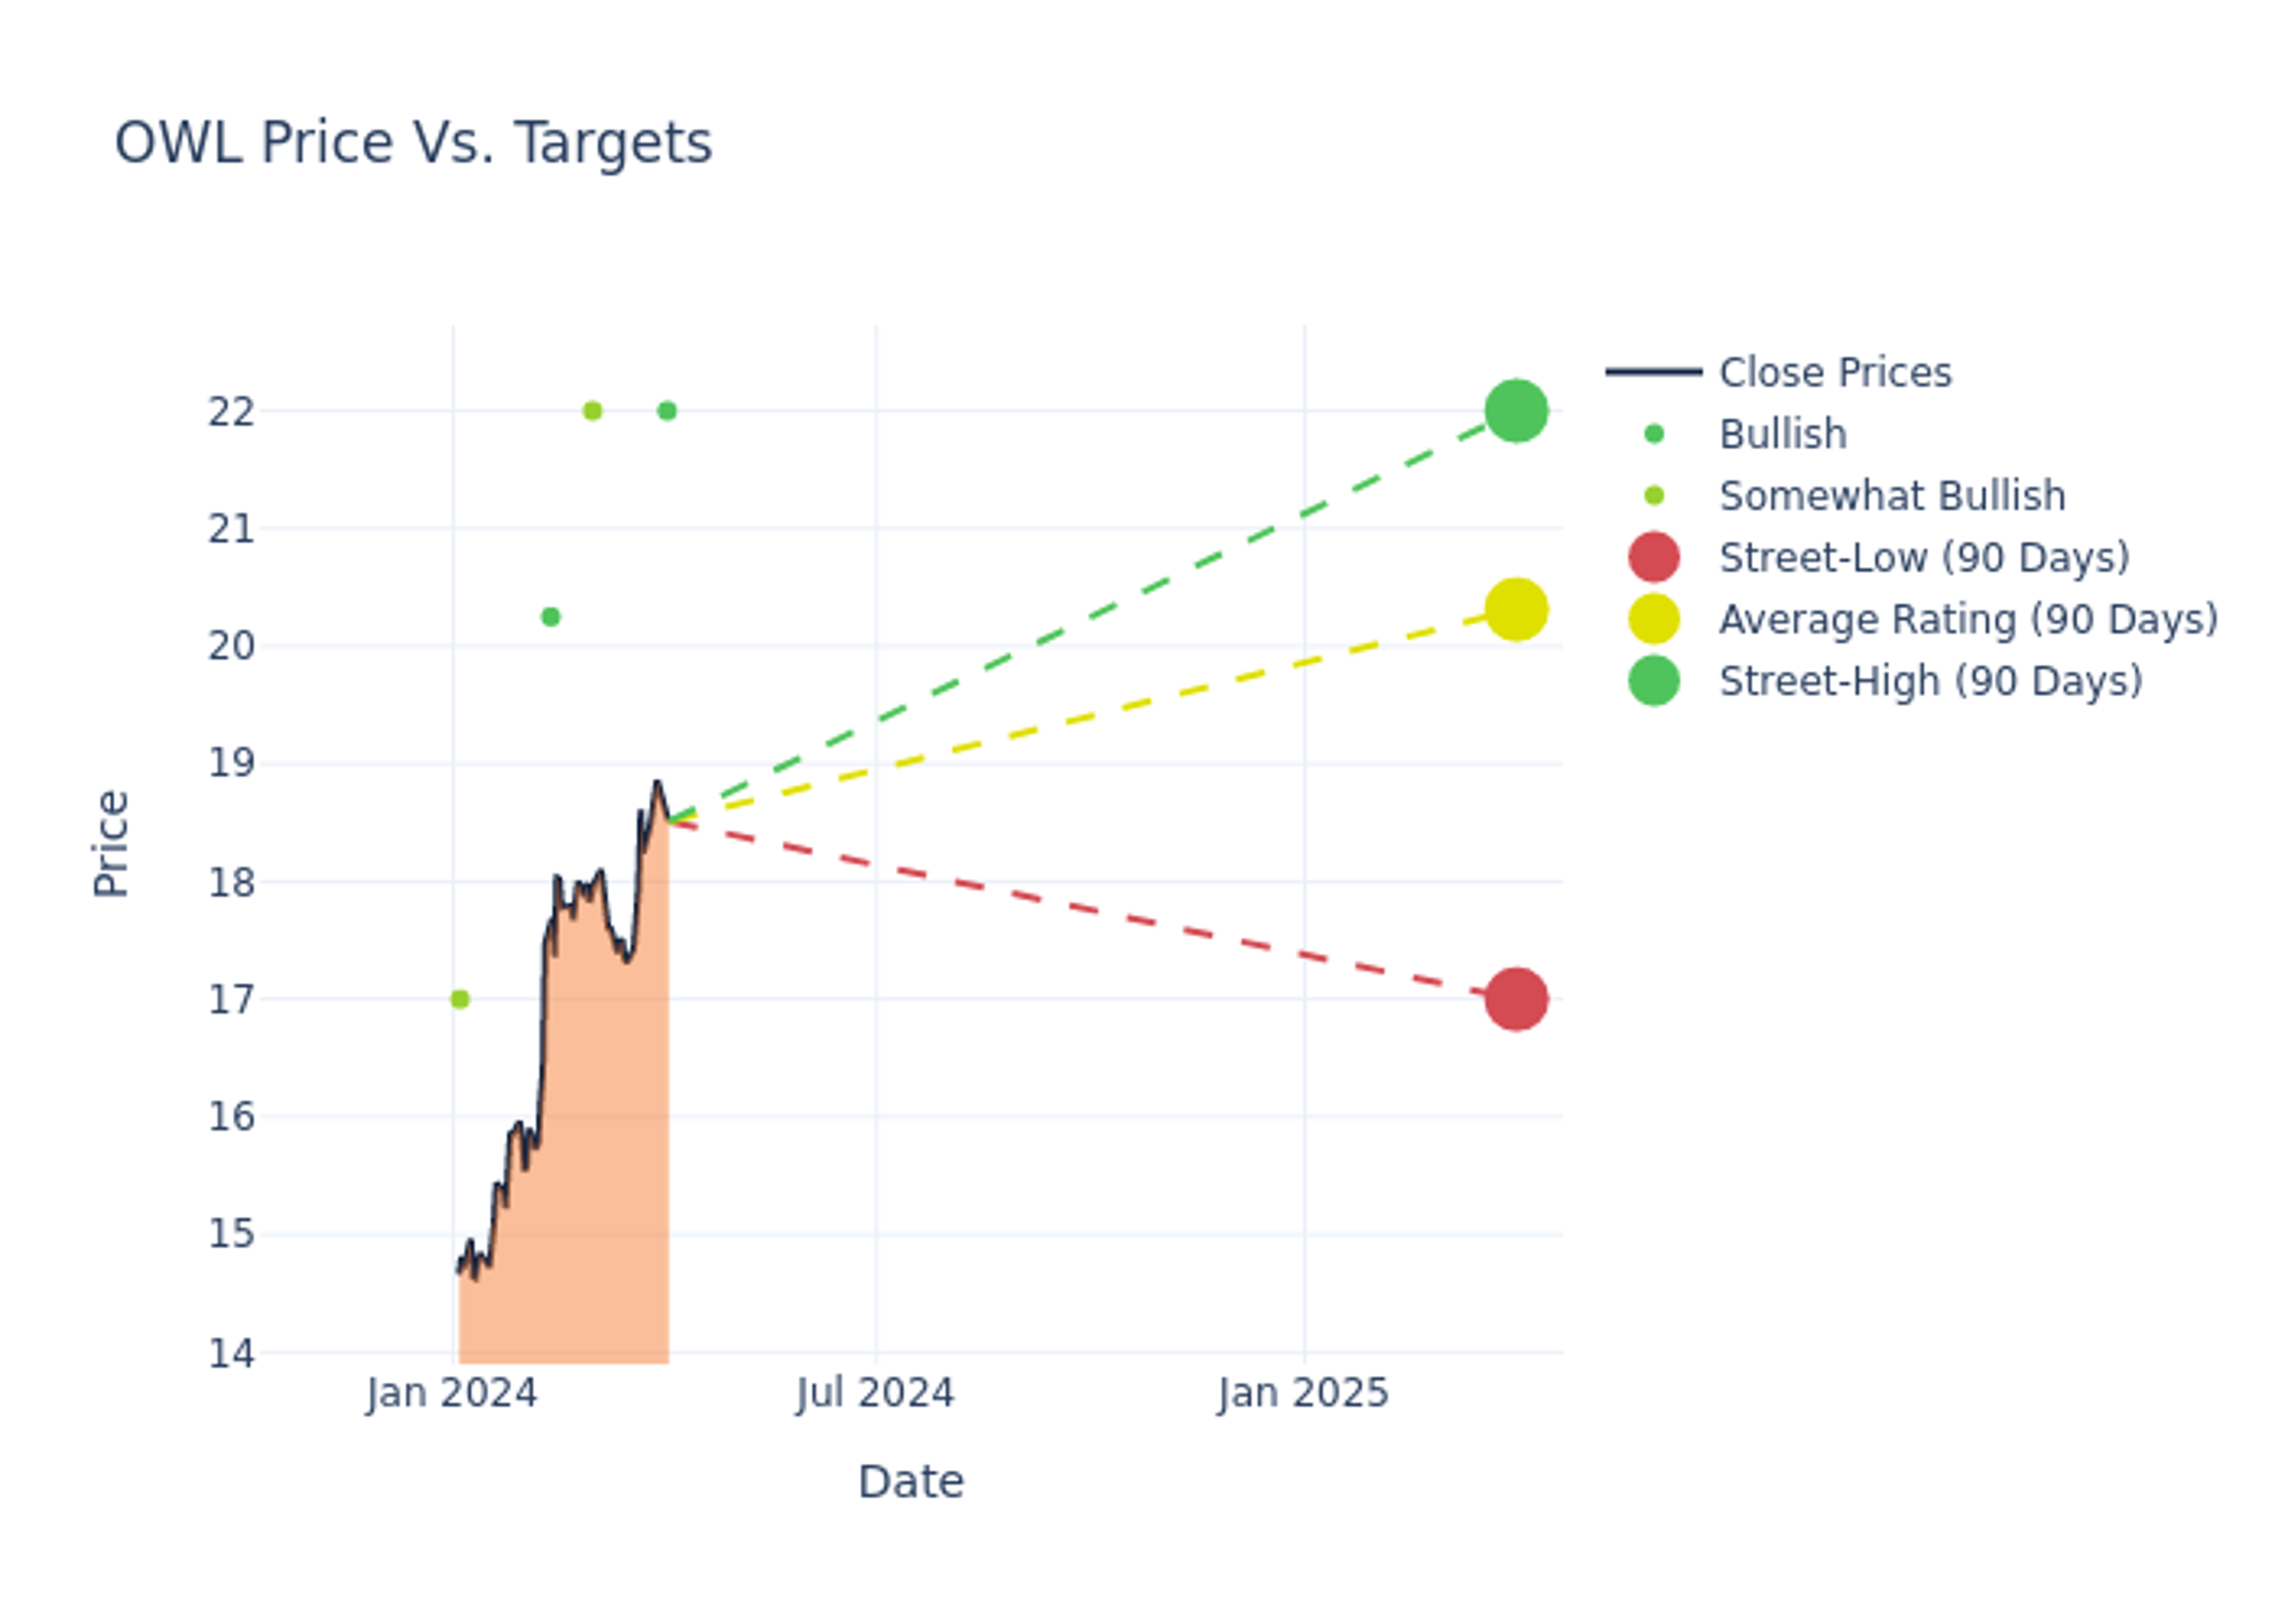
Analysts have set 12-month price targets for Blue Owl Cap, revealing an average target of $20.31, a high estimate of $22.00, and a low estimate of $17.00. Surpassing the previous average price target of $18.58, the current average has increased by 9.31%.

Analyzing Analyst Ratings: A Detailed Breakdown
The standing of Blue Owl Cap among financial experts is revealed through an in-depth exploration of recent analyst actions. The summary below outlines key analysts, their recent evaluations, and adjustments to ratings and price targets.
| Analyst | Analyst Firm | Action Taken | Rating | Current Price Target | Prior Price Target |
|---|---|---|---|---|---|
| Brennan Hawken | UBS | Raises | Buy | $22.00 | $18.00 |
| Crispin Love | Piper Sandler | Raises | Overweight | $22.00 | $20.00 |
| Alexander Blostein | Goldman Sachs | Raises | Buy | $20.25 | $17.75 |
| Bill Kirk | TD Cowen | Announces | Outperform | $17.00 | - |
Key Insights:
- Action Taken: Responding to changing market dynamics and company performance, analysts update their recommendations. Whether they 'Maintain', 'Raise', or 'Lower' their stance, it signifies their response to recent developments related to Blue Owl Cap. This offers insight into analysts' perspectives on the current state of the company.
- Rating: Analyzing trends, analysts offer qualitative evaluations, ranging from 'Outperform' to 'Underperform'. These ratings convey expectations for the relative performance of Blue Owl Cap compared to the broader market.
- Price Targets: Analysts predict movements in price targets, offering estimates for Blue Owl Cap's future value. Examining the current and prior targets offers insights into analysts' evolving expectations.
Understanding these analyst evaluations alongside key financial indicators can offer valuable insights into Blue Owl Cap's market standing. Stay informed and make well-considered decisions with our Ratings Table.
Stay up to date on Blue Owl Cap analyst ratings.
Discovering Blue Owl Cap: A Closer Look
Blue Owl Capital Inc is an alternative asset management firm. The Company deploys private capital across Credit, GP Strategic Capital, and Real Estate platforms on behalf of institutional and private wealth clients. The Company conducts its operations through Blue Owl Capital Holdings LP ("Blue Owl Holdings") and Blue Owl Capital Carry LP ("Blue Owl Carry"). Its investor base includes a diversified mix of institutional investors, including public and private pension funds, endowments, foundations, family offices, private banks, high-net-worth individuals, asset managers, and insurance companies. The Company generates substantially all of its revenues in the United states.
Blue Owl Cap: Financial Performance Dissected
Market Capitalization Perspectives: The company's market capitalization falls below industry averages, signaling a relatively smaller size compared to peers. This positioning may be influenced by factors such as perceived growth potential or operational scale.
Revenue Growth: Over the 3 months period, Blue Owl Cap showcased positive performance, achieving a revenue growth rate of 24.91% as of 31 December, 2023. This reflects a substantial increase in the company's top-line earnings. As compared to competitors, the company surpassed expectations with a growth rate higher than the average among peers in the Financials sector.
Net Margin: Blue Owl Cap's net margin is below industry averages, indicating potential challenges in maintaining strong profitability. With a net margin of 3.66%, the company may face hurdles in effective cost management.
Return on Equity (ROE): Blue Owl Cap's ROE falls below industry averages, indicating challenges in efficiently using equity capital. With an ROE of 1.18%, the company may face hurdles in generating optimal returns for shareholders.
Return on Assets (ROA): Blue Owl Cap's ROA falls below industry averages, indicating challenges in efficiently utilizing assets. With an ROA of 0.21%, the company may face hurdles in generating optimal returns from its assets.
Debt Management: Blue Owl Cap's debt-to-equity ratio is below the industry average at 1.31, reflecting a lower dependency on debt financing and a more conservative financial approach.
The Core of Analyst Ratings: What Every Investor Should Know
Analyst ratings serve as essential indicators of stock performance, provided by experts in banking and financial systems. These specialists diligently analyze company financial statements, participate in conference calls, and engage with insiders to generate quarterly ratings for individual stocks.
Analysts may enhance their evaluations by incorporating forecasts for metrics like growth estimates, earnings, and revenue, delivering additional guidance to investors. It is vital to acknowledge that, although experts in stocks and sectors, analysts are human and express their opinions when providing insights.
This article was generated by Benzinga's automated content engine and reviewed by an editor.
© 2025 Benzinga.com. Benzinga does not provide investment advice. All rights reserved.