
Have you ever had a friend you’ve lent a caring ear, to listen to their relationship issues? All the while listening, you’re saying to yourself, this relationship appears doomed. Nonetheless, you just can’t bring yourself to providing that type of advice? That’s what I fear is taking place within the stock market. Is the party is over, and the market will be the last to know? Holding up at these levels is not impressive as the pundits on CNBC would have you believe. It’s simply a doomed relationship that will not work out, and this will be another tragic ending to a movie retail investors have seen all too many times.
In October of 2022 the stock market was at it’s lows due to the Federal Reserve’s escalation of the fed funds rate. Fast forward to today, rates are higher than at the October lows in the market but the S&P 500 now sits less than 10% from its all-time historic highs.

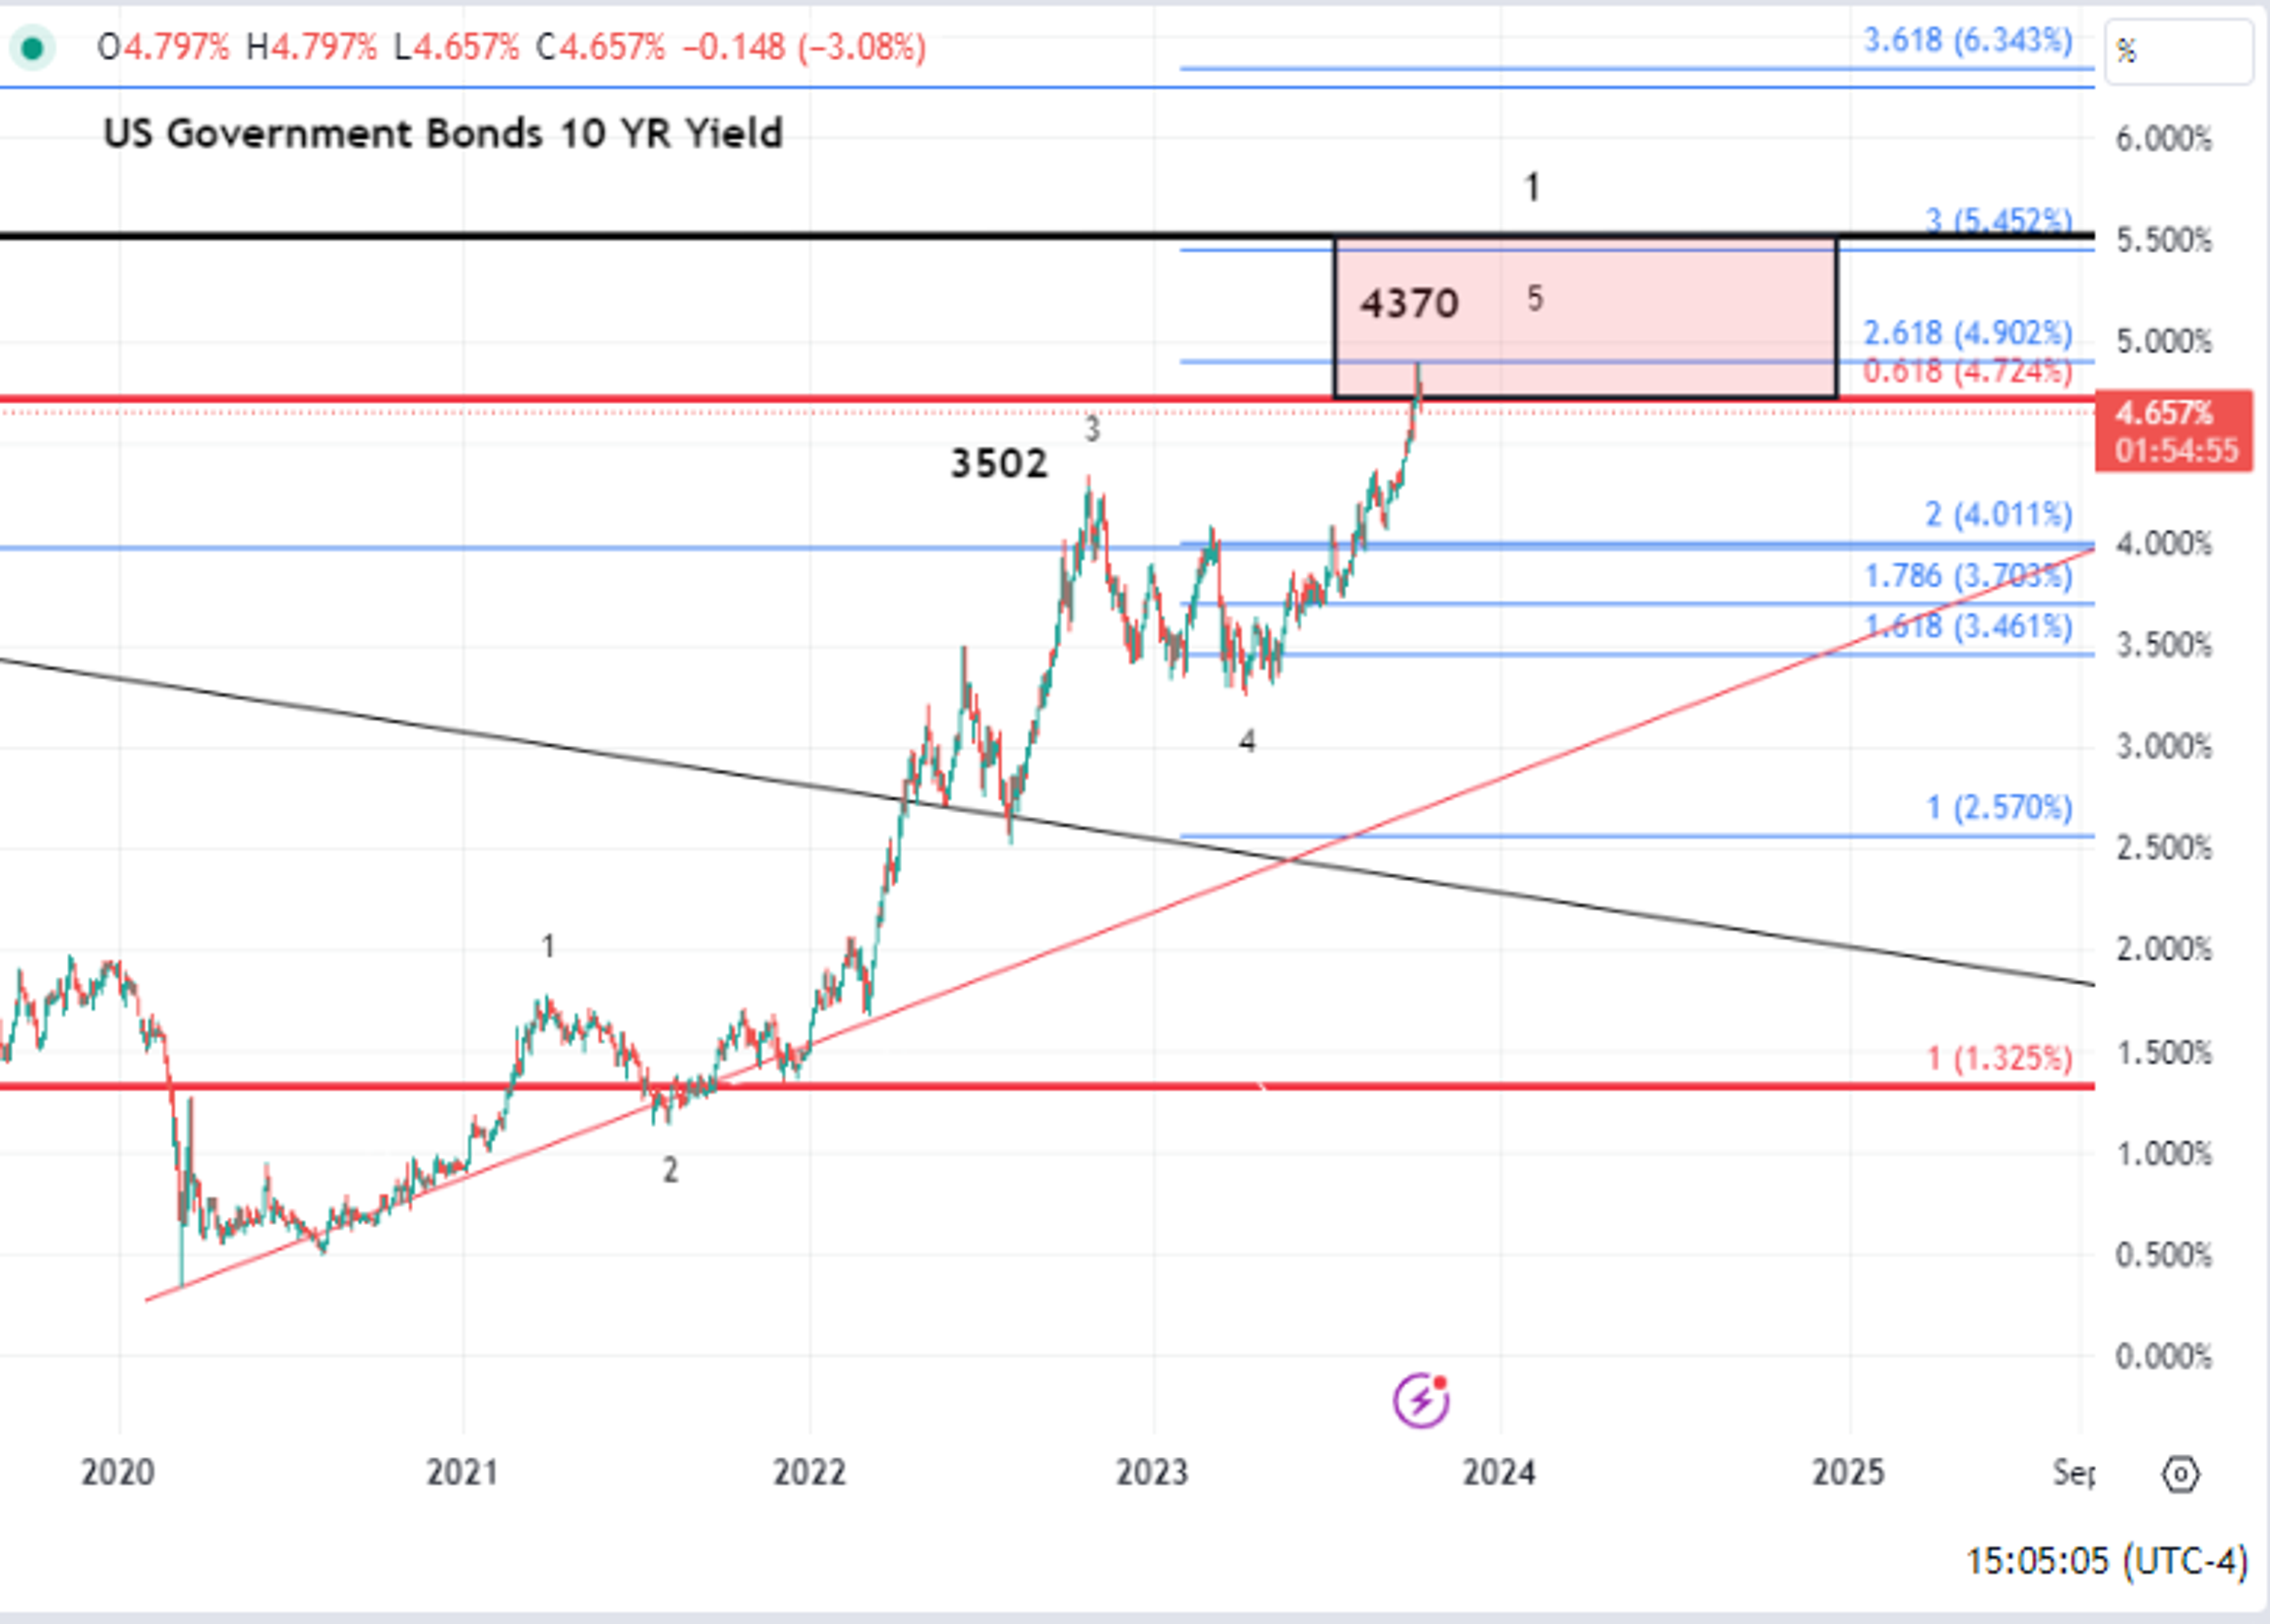
The above chart of the US 10-year bond yield shows that in October of 2022 when the yield on the 10 year was 4.3% the S&P 500 was 3502, but now with the yield at just under 5%, the index stands at just under 4,400. Has the market decided the impact of higher interest rates should no longer be cause for concern? I guess my freshmen economics professor was wrong when he taught us that in the headwinds of rising interest rates, assets will become cheaper. The costs associated with financing assets are now substantially higher. Therefore, demand should moderate and slow down to digest those higher costs.
Now granted a market as complex as the US stock market indices are not linear in nature, and from time to time will represent an irrational perspective. The problem with this ebb and flow away and towards a more linear correlation creates bubbles and busts. Its human nature involved in the markets, and market participants are rarely going to agree on what should drive the markets at any given time. However, in the end, these results of human nature, will always be supplanted by physics.
It’s a simple case of gravity.
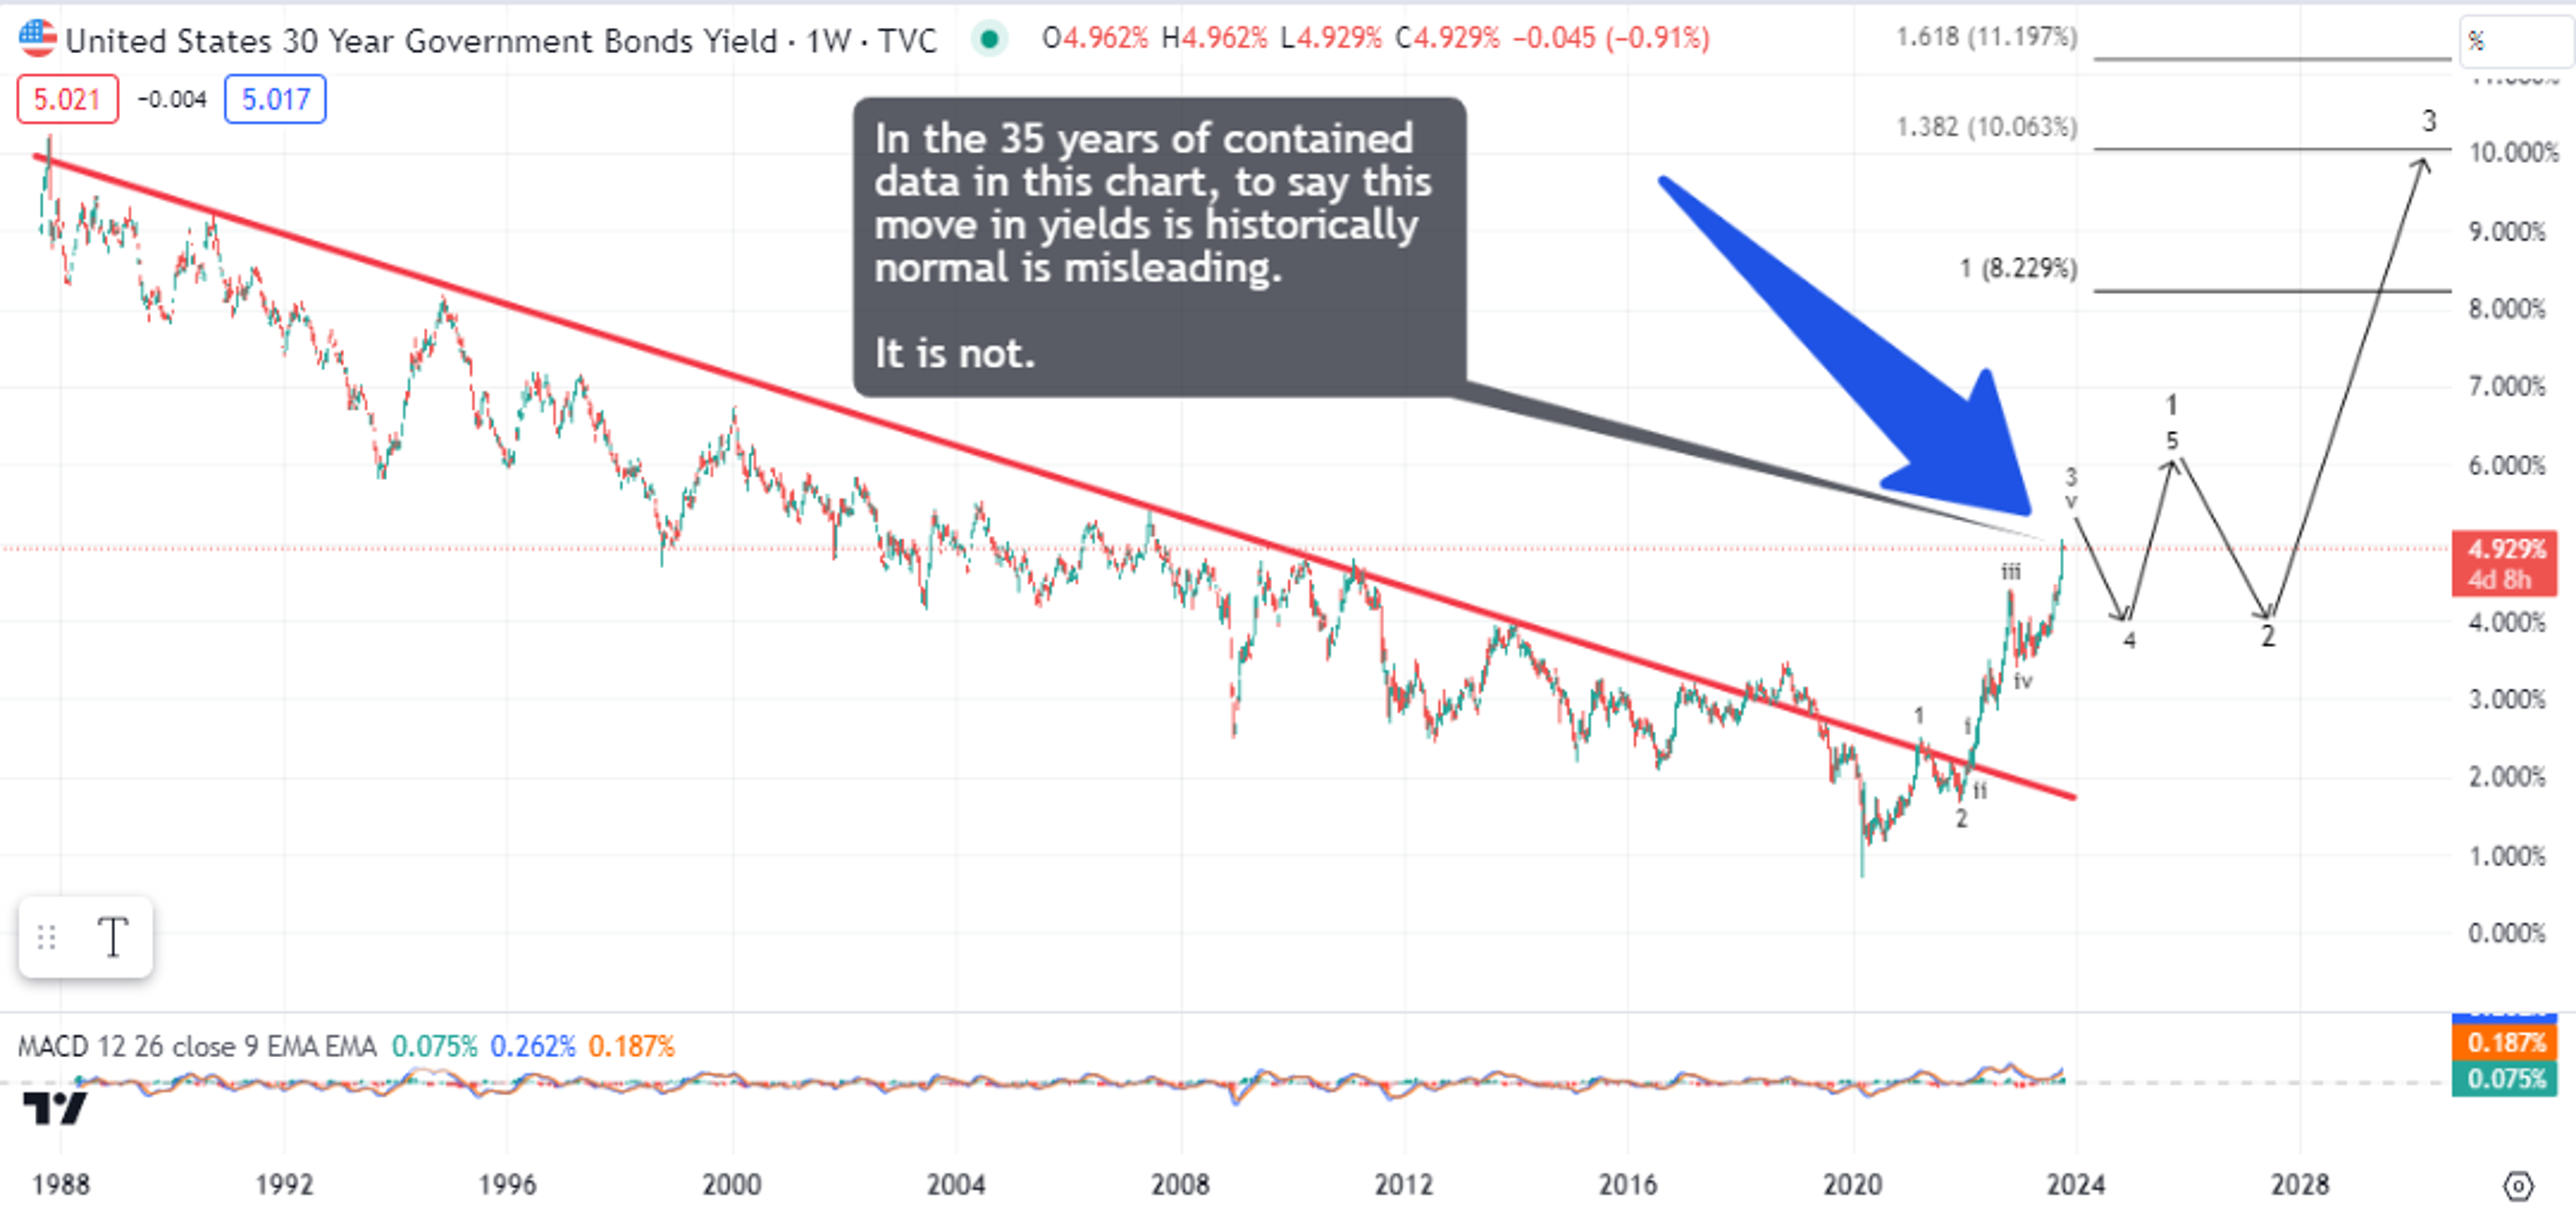
Here’s another a visual way to explain this. This is a chart dating back 35 years shows that the long-term trajectory of long-term interest rates have clearly deviated from their historical trend. This is not the 2y yield, nor the 10y yield, this is the yield on 30y bonds.
Long-term borrowing costs are reverting back to a mean I fear predates the data contained with the below chart. I think if this pattern persists, 10% is a real possibility on the 30y bond.

So, what does it all it mean?
If the housing market is slowing under the pressure of 7% mortgage rates, it stands to reason that housing prices and real estate activity will NOT be in a healthier position at 12%.
If my freshman economics professor was right and interest rates and assets, over the long term, are inversely related, the below should be the result.

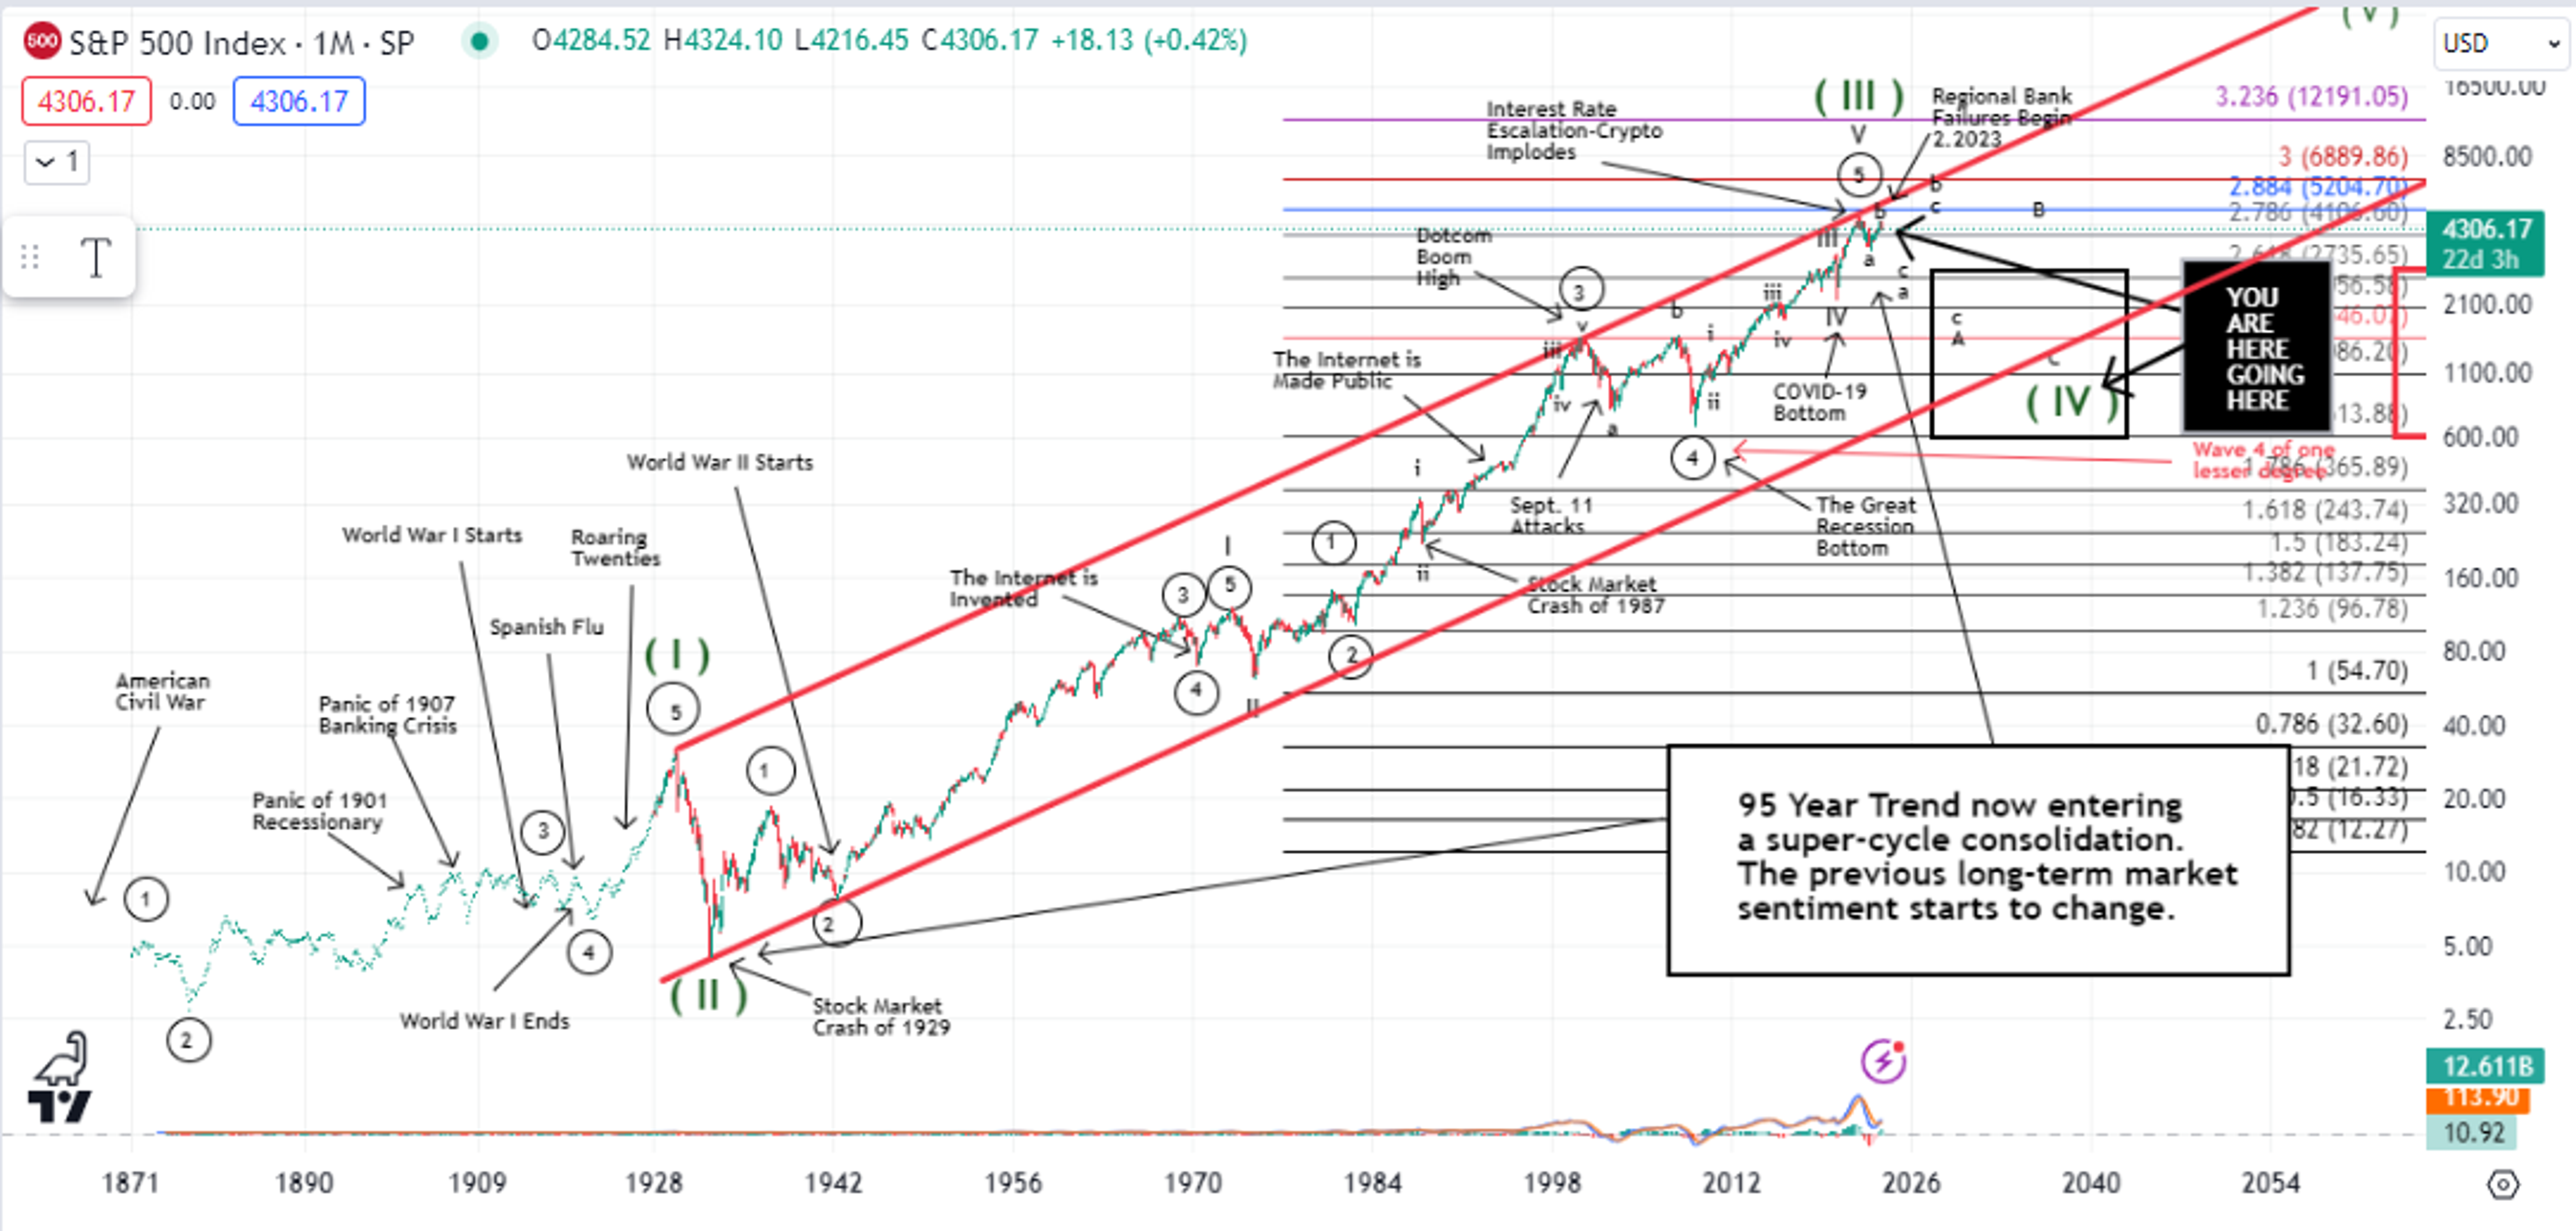
The above suggests we are just beginning a 10–20-year consolidation phase of gains dating back from 1929. This type of price action would more than likely take us ultimately to the 1200 SPX area. This would not be the result of any stock market crash. This would be an area of choppy price action that would stretch out for a long time.
Yes, many things are taking place in the US economy that seem unprecedented. The shrinking of the money supply is occurring at a rate that has not happened as far back as I can compile data.

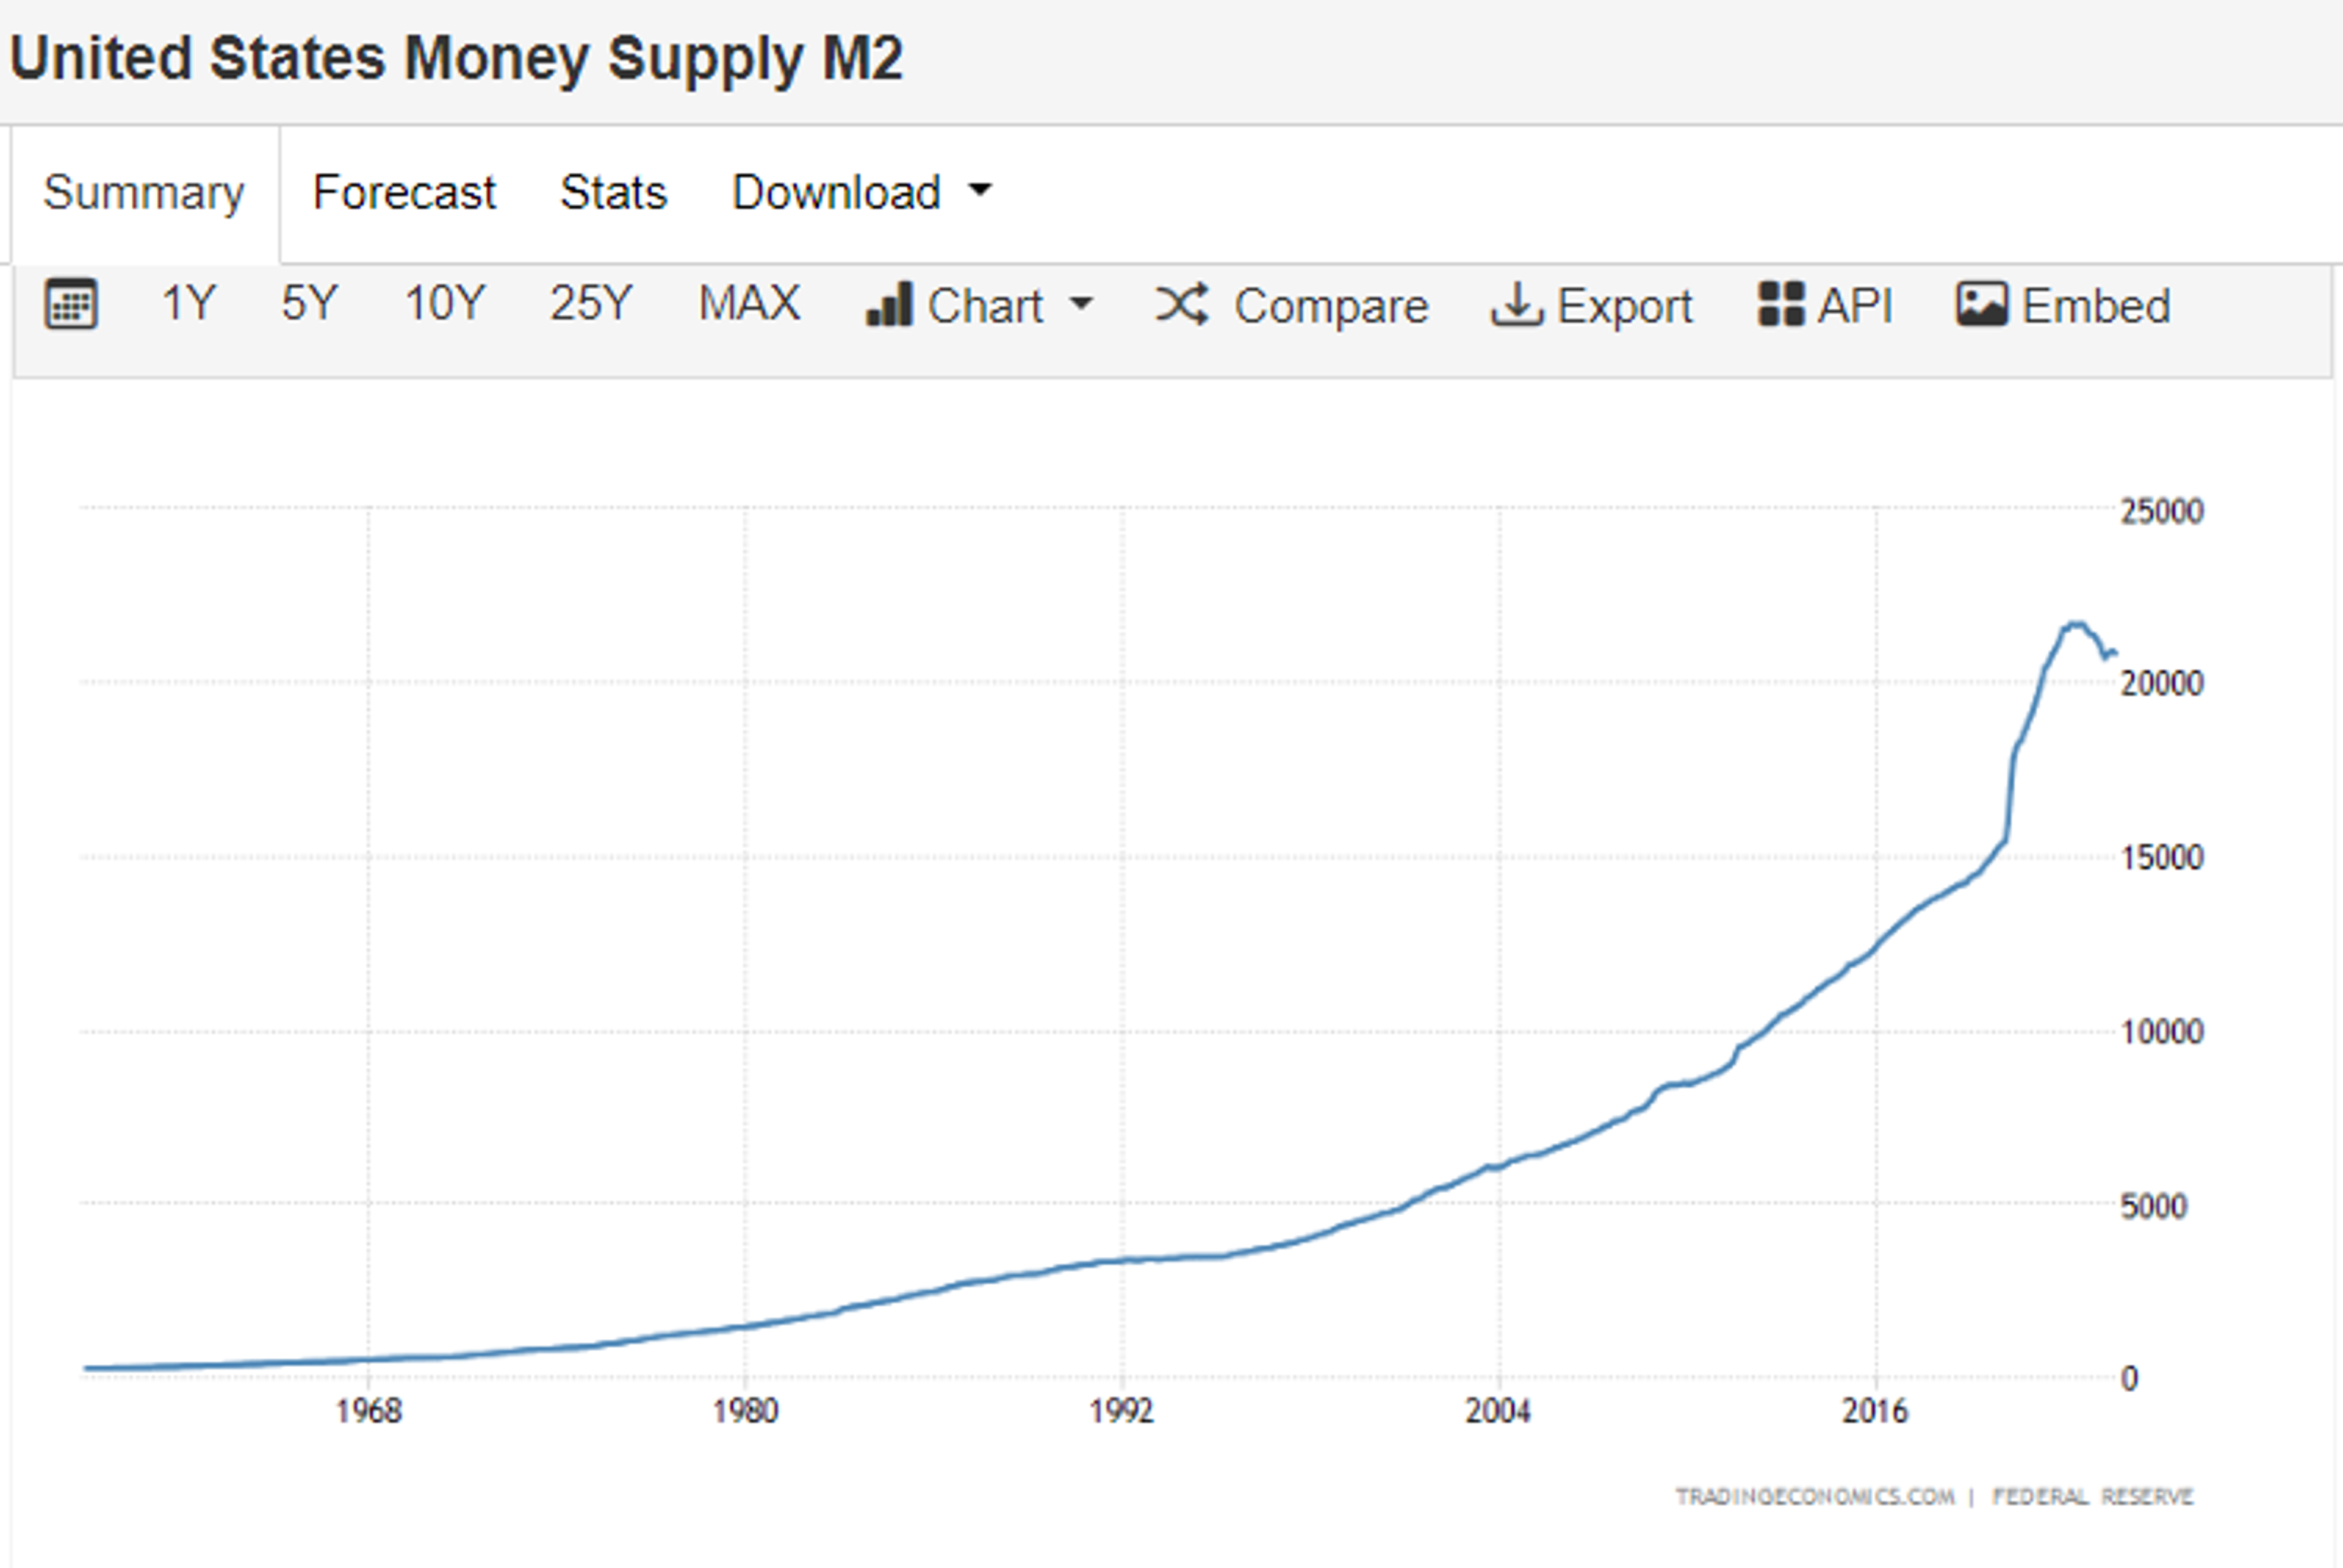
Is this the Quantitative Easing chickens coming home to roost? I do think the word unprecedented is thrown around a lot lately with respect to our economy. However, in the face of some serious headwinds facing the US markets, and no rational tailwinds (aside from money managers talking up their books), I wonder what the rational thesis is for markets to be so close to historical high valuations.
Chris Maikisch started his career in retail investment banking and quickly switched over to analyzing markets using his firms’ proprietary methods. In 2012 he began studying Elliott Wave Theory and now uses this methodology exclusively as lead analyst at EWTdaily.com covering tier-1 cryptocurrencies and the US stock market indices.
© 2025 Benzinga.com. Benzinga does not provide investment advice. All rights reserved.