Benzinga

España
Italia
대한민국
日本
Français
Benzinga Edge
Benzinga Research
Benzinga Pro

  • Get Benzinga Pro
  • Data & APIs
  • Events
  • Premarket
  • Advertise
Contribute
España
Italia
대한민국
日本
Français

Benzinga

  • Premium Services
  • Financial News
    Latest
    Earnings
    Guidance
    Dividends
    M&A
    Buybacks
    Interviews
    Management
    Offerings
    IPOs
    Insider Trades
    Biotech/FDA
    Politics
    Healthcare
    Small-Cap
  • Markets
    Pre-Market
    After Hours
    Movers
    ETFs
    Options
    Cryptocurrency
    Commodities
    Bonds
    Futures
    Mining
    Real Estate
    Volatility
  • Ratings
    Analyst Color
    Downgrades
    Upgrades
    Initiations
    Price Target
  • Investing Ideas
    Trade Ideas
    Long Ideas
    Short Ideas
    Technicals
    Analyst Ratings
    Analyst Color
    Latest Rumors
    Whisper Index
    Stock of the Day
    Best Stocks & ETFs
    Best Penny Stocks
    Best S&P 500 ETFs
    Best Swing Trade Stocks
    Best Blue Chip Stocks
    Best High-Volume Penny Stocks
    Best Small Cap ETFs
    Best Stocks to Day Trade
    Best REITs
  • Money
    Investing
    Cryptocurrency
    Mortgage
    Insurance
    Yield
    Personal Finance
    Forex
    Startup Investing
    Real Estate Investing
    Prop Trading
    Credit Cards
    Stock Brokers
Research
My Stocks
Tools
Free Benzinga Pro Trial
Calendars
Analyst Ratings Calendar
Conference Call Calendar
Dividend Calendar
Earnings Calendar
Economic Calendar
FDA Calendar
Guidance Calendar
IPO Calendar
M&A Calendar
Unusual Options Activity Calendar
SPAC Calendar
Stock Split Calendar
Trade Ideas
Free Stock Reports
Insider Trades
Trade Idea Feed
Analyst Ratings
Unusual Options Activity
Heatmaps
Free Newsletter
Government Trades
Perfect Stock Portfolio
Easy Income Portfolio
Short Interest
Most Shorted
Largest Increase
Largest Decrease
Calculators
Margin Calculator
Forex Profit Calculator
100x Options Profit Calculator
Screeners
Stock Screener
Top Momentum Stocks
Top Quality Stocks
Top Value Stocks
Top Growth Stocks
Compare Best Stocks
Best Momentum Stocks
Best Quality Stocks
Best Value Stocks
Best Growth Stocks
Connect With Us
facebookinstagramlinkedintwitteryoutubeblueskymastodon
About Benzinga
  • About Us
  • Careers
  • Advertise
  • Contact Us
Market Resources
  • Advanced Stock Screener Tools
  • Options Trading Chain Analysis
  • Comprehensive Earnings Calendar
  • Dividend Investor Calendar and Alerts
  • Economic Calendar and Market Events
  • IPO Calendar and New Listings
  • Market Outlook and Analysis
  • Wall Street Analyst Ratings and Targets
Trading Tools & Education
  • Benzinga Pro Trading Platform
  • Options Trading Strategies and News
  • Stock Market Trading Ideas and Analysis
  • Technical Analysis Charts and Indicators
  • Fundamental Analysis and Valuation
  • Day Trading Guides and Strategies
  • Live Investor Events
  • Pre-market Stock Analysis and News
  • Cryptocurrency Market Analysis and News
Ring the Bell

A newsletter built for market enthusiasts by market enthusiasts. Top stories, top movers, and trade ideas delivered to your inbox every weekday before and after the market closes.

  • Terms & Conditions
  • Do Not Sell My Personal Data/Privacy Policy
  • Disclaimer
  • Service Status
  • Sitemap
© 2026 Benzinga | All Rights Reserved
November 3, 2023 9:07 AM 2 min read

The End Of Monday Blues? New Data Reveals Shift In Stock Market Patterns

by Surbhi Jain
Follow

ArticleFeaturedTickersList12345!!!

Monday blues? No more—at least not for U.S. investors.

Remember, the “Weekend Effect”? Traditionally, the weekend effect has implied that stock returns on Mondays are often notably lower than those of the preceding Friday. Monday’s lows would offer investors ample opportunities to lap up undervalued and bargain stocks.

See More: Best Time of Day to Buy and Trade Stocks

This is changing. The erstwhile Monday effect now appears to be dissipating.

Evidence can be seen in the figures below.

Benzinga’s review of the performance of the three major U.S. market-tracking indices provides a very interesting conclusion. Over the last six months, the stock market experienced gains on 20 out of 24 Mondays.

That’s 83% of Mondays ending in the green. Here’s a chart depicting the findings:

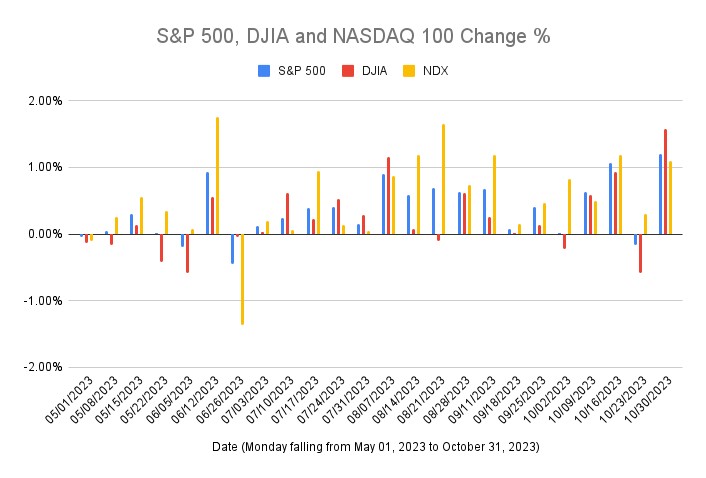
Source: Created by Author

Of the 24 Mondays between May 1, 2023 and Oct. 31, 2023, the S&P 500 Index (SPX) closed positive 20 times, implying an 83.33% probability for the market to close higher on Monday.

Over the same period, the Dow Jones Industrial Average (DJIA) closed positive 66.67% of the time, i.e. on 16 Mondays. The tech-heavy NASDAQ-100 (NDX) closed positive 91.67% times (22 Mondays) over the review period.

The S&P 500 Index

The S&P 500 index tracks the performance of 500 of the largest companies trading on the U.S. stock exchanges. The index is computed in a free-float market capitalization-weighted methodology. Some of the popular exchange-traded funds (ETFs) tracking this index include:

  • SPDR S&P 500 ETF Trust (NYSE:SPY)
  • iShares Core S&P 500 ETF (NYSE:IVV)
  • Vanguard S&P 500 ETF (NYSE:VOO)

The Dow Jones Industrial Average Index

The DJIA is a price-weighted index that tracks 30 large capitalization stocks trading on the U.S. stock market. The SPDR Dow Jones Industrial Average ETF (NYSE:DIA) Trust is a popular ETF tracking this index.

The NASDAQ-100 Index

Read Next: Best ETFs to Buy Right Now

Photo: Shutterstock

Market News and Data brought to you by Benzinga APIs

© 2026 Benzinga.com. Benzinga does not provide investment advice. All rights reserved.

To add Benzinga News as your preferred source on Google, click here.


Posted In:
Broad U.S. Equity ETFs
DIA Logo
DIASPDR Dow Jones Industrial Average ETF
$500.68-0.07%
Overview
DJIA Logo
DJIAGlobal X Dow 30 Covered Call ETF
$22.490.18%
IVV Logo
IVViShares Core S&P 500 ETF
$695.890.30%
QQQ Logo
QQQInvesco QQQ Trust, Series 1
$612.170.41%
QQQM Logo
QQQMInvesco NASDAQ 100 ETF
$252.040.41%
SPY Logo
SPYState Street SPDR S&P 500 ETF Trust
$692.830.32%
VOO Logo
VOOVanguard S&P 500 ETF
$637.190.31%

The NDX uses a modified capitalization methodology for stock selection from stocks listed on the NASDAQ exchange. The index tracks 100 of the largest non-financial companies listed on the NASDAQ. Popular ETFs tracking this index include the Invesco QQQ Trust Series I (NASDAQ:QQQ) and the Invesco NASDAQ 100 ETF (NASDAQ:QQQM).

DIA Logo
DIASPDR Dow Jones Industrial Average ETF
$500.68-0.07%
Overview
DJIA Logo
DJIAGlobal X Dow 30 Covered Call ETF
$22.490.18%
IVV Logo
IVViShares Core S&P 500 ETF
$695.890.30%
QQQ Logo
QQQInvesco QQQ Trust, Series 1
$612.170.41%
QQQM Logo
QQQMInvesco NASDAQ 100 ETF
$252.040.41%
SPY Logo
SPYState Street SPDR S&P 500 ETF Trust
$692.830.32%
VOO Logo
VOOVanguard S&P 500 ETF
$637.190.31%
Comments
Loading...