
This article represents an exercise I like to call the “Single Stock Portfolio”. You can only own one stock in your portfolio for the next three months, and you can pick any one of the following eight stocks. Which one would you select, and why?
The beauty of this exercise is that it forces you to consider eight different charts, some with similar characteristics, yet some showing dramatic differences. In the end, you have to decide whether to stick with a top-performing name like NVDA, fresh off new all-time highs in March but showing the dreaded bearish momentum divergence. Or you could opt for AAPL, testing price and Fibonacci support after failing to make new all-time highs.
Let’s review each of these charts in turn and lay out a good technical framework for our decision.


Nvidia Corp. (NVDA)
Nvidia is the top-ranked of the group using the StockCharts Technical Rating (SCTR), with its trend scoring in the top 2% of all large cap stocks. NVDA also features a bearish momentum divergence, with higher closing prices in March but lower highs in momentum based on the RSI indicator. This stock currently sits around 69% above its 200-day moving average, suggesting it could be quite overextended here.


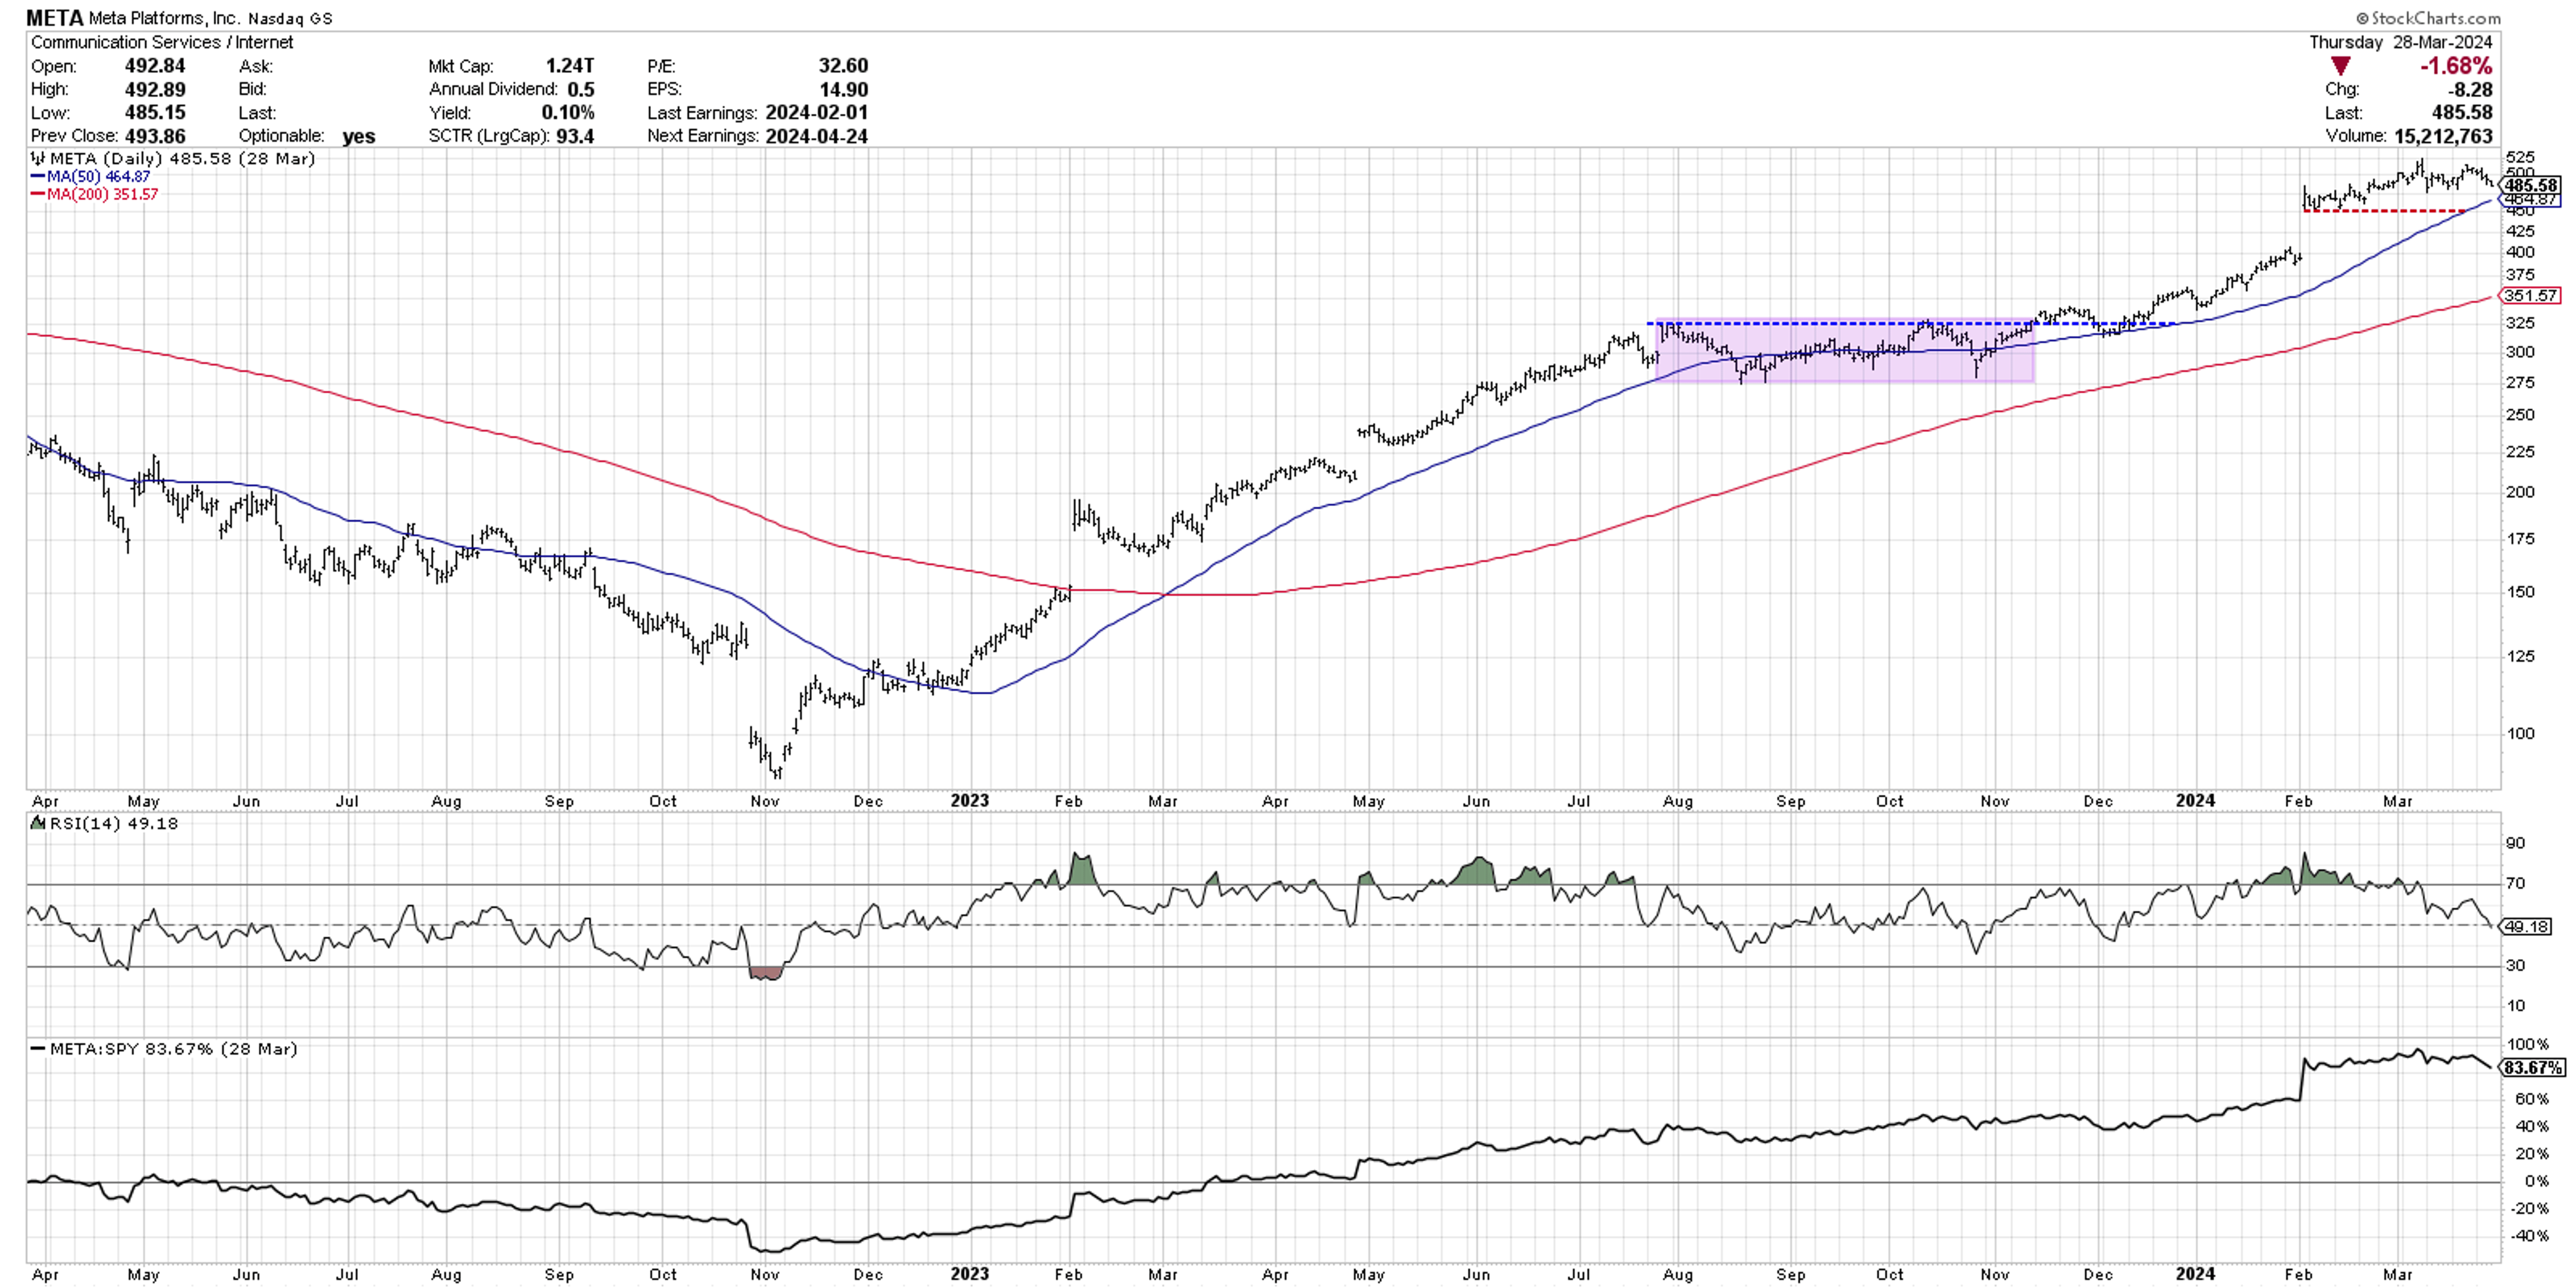
Meta Platforms, Inc. (META)
META is featuring weakening momentum characteristics as well, with RSI dipping below 50 this week for the first time since December 2023. Both of these stocks still remain above two upward-sloping moving averages, suggesting the long-term uptrend is very much intact.

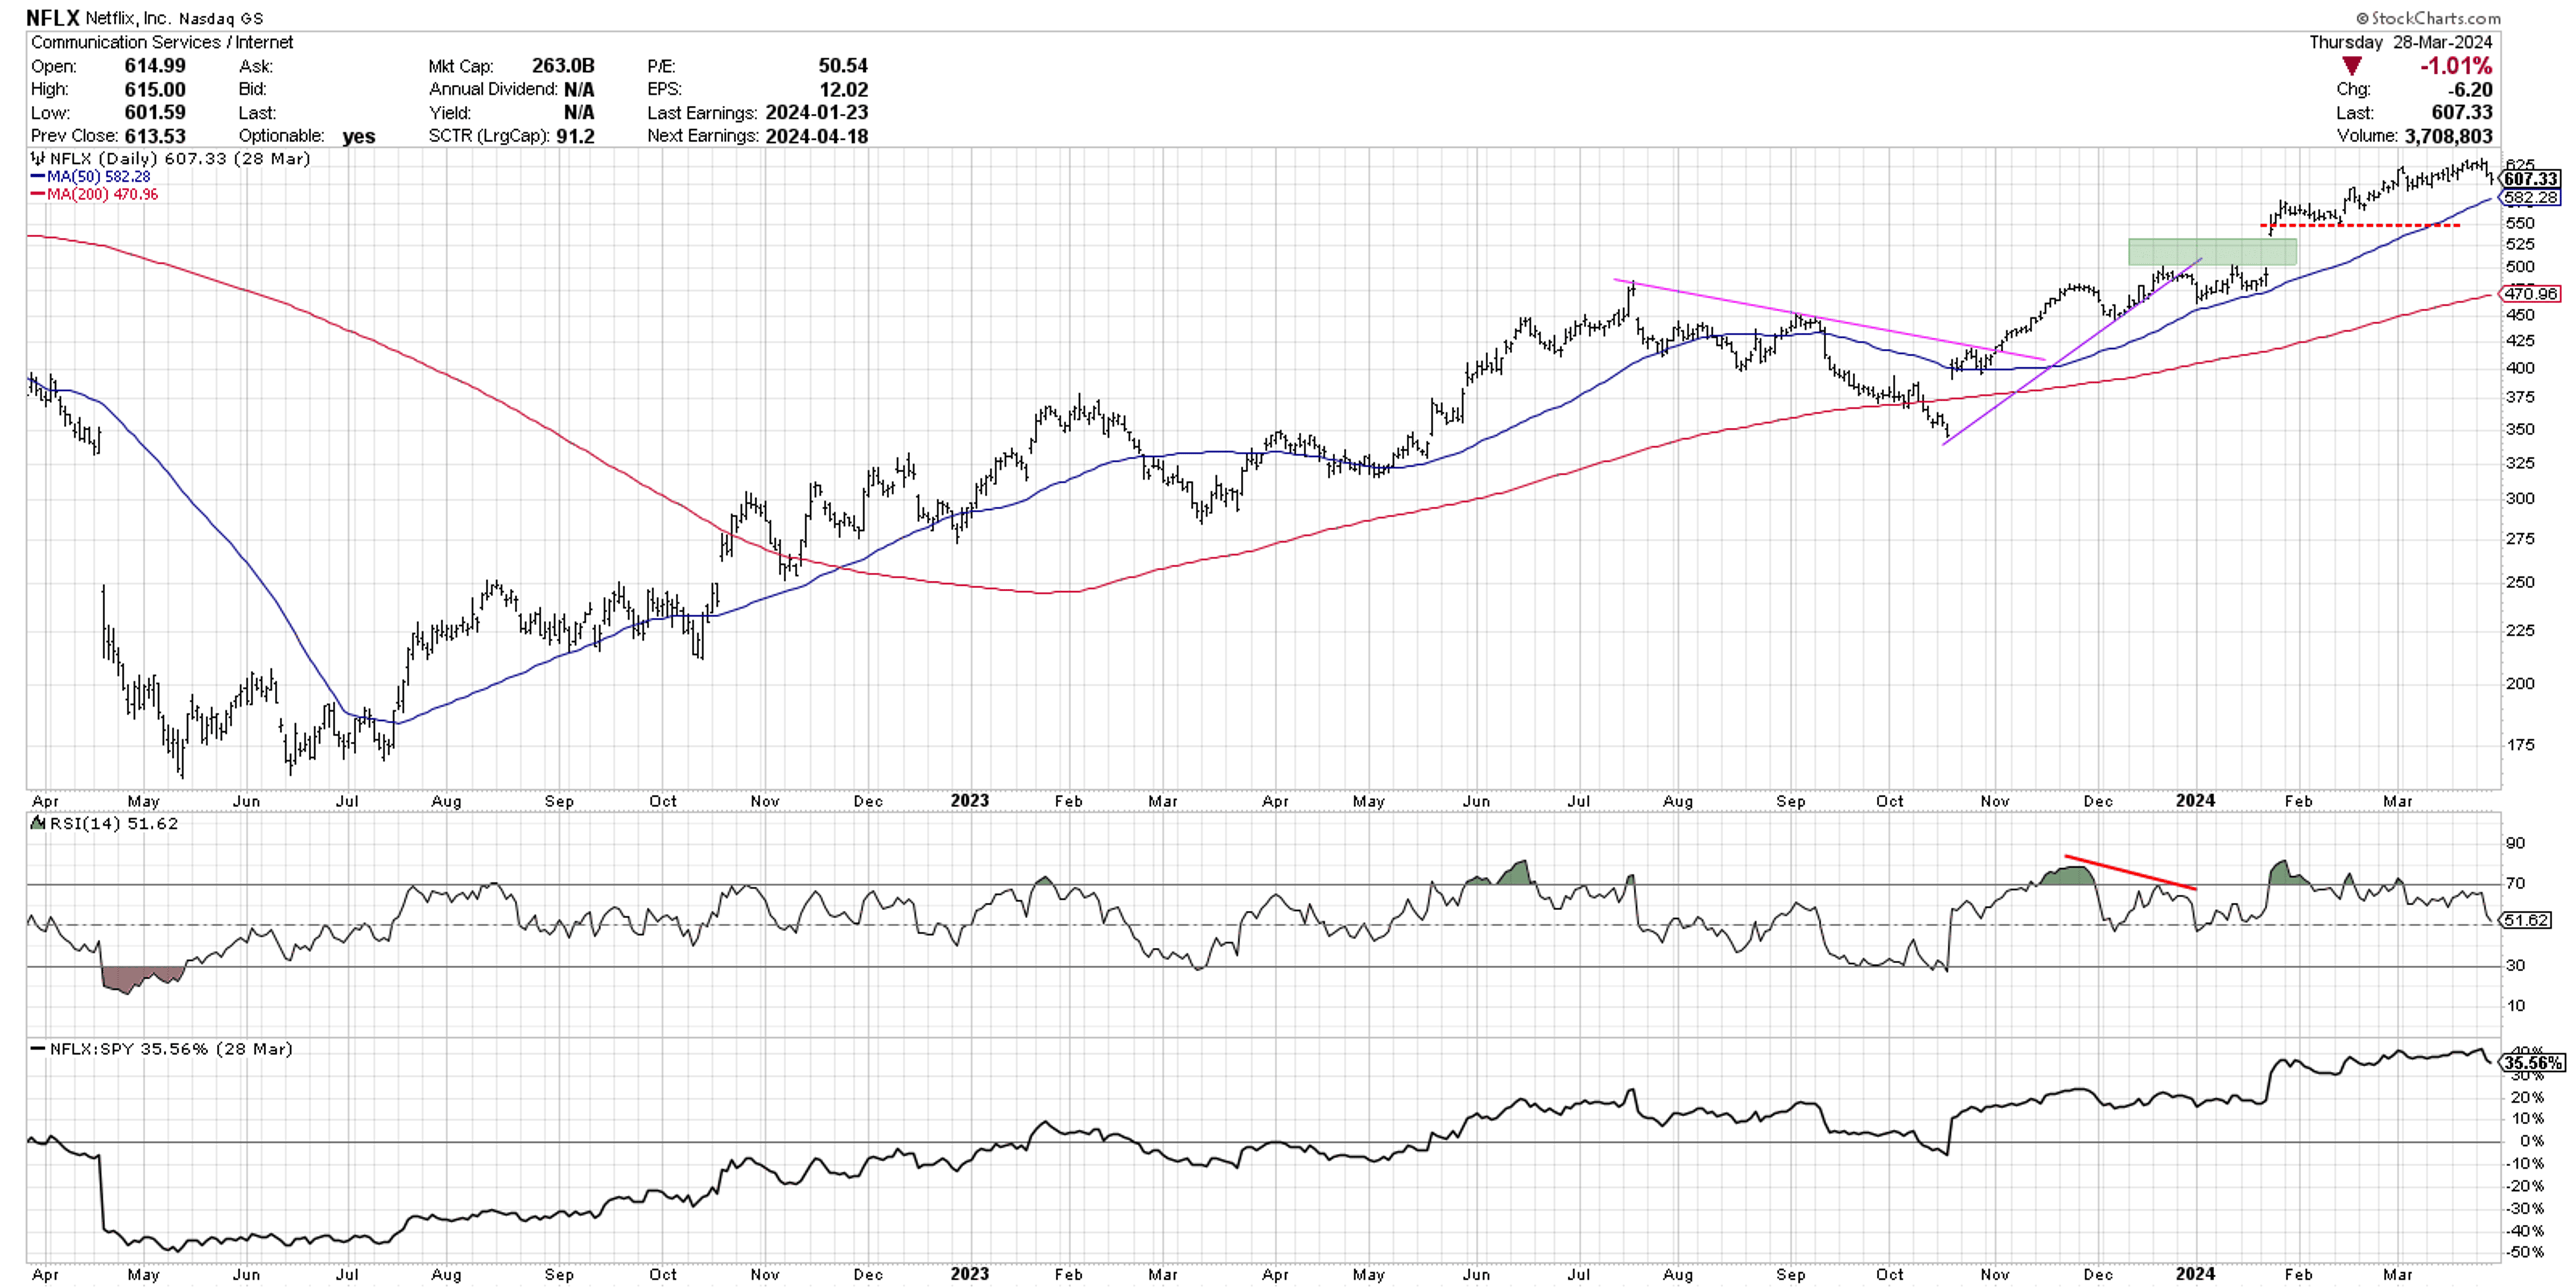
Netflix, Inc. (NFLX)
Our third chart again demonstrates a classic bearish momentum divergence, with highs in January, February, and March all marked by lower peaks in the RSI. This suggests less and less upward momentum behind these successive new highs. The relative strength, however, remains quite strong as NFLX has consistently outperformed the S&P 500.
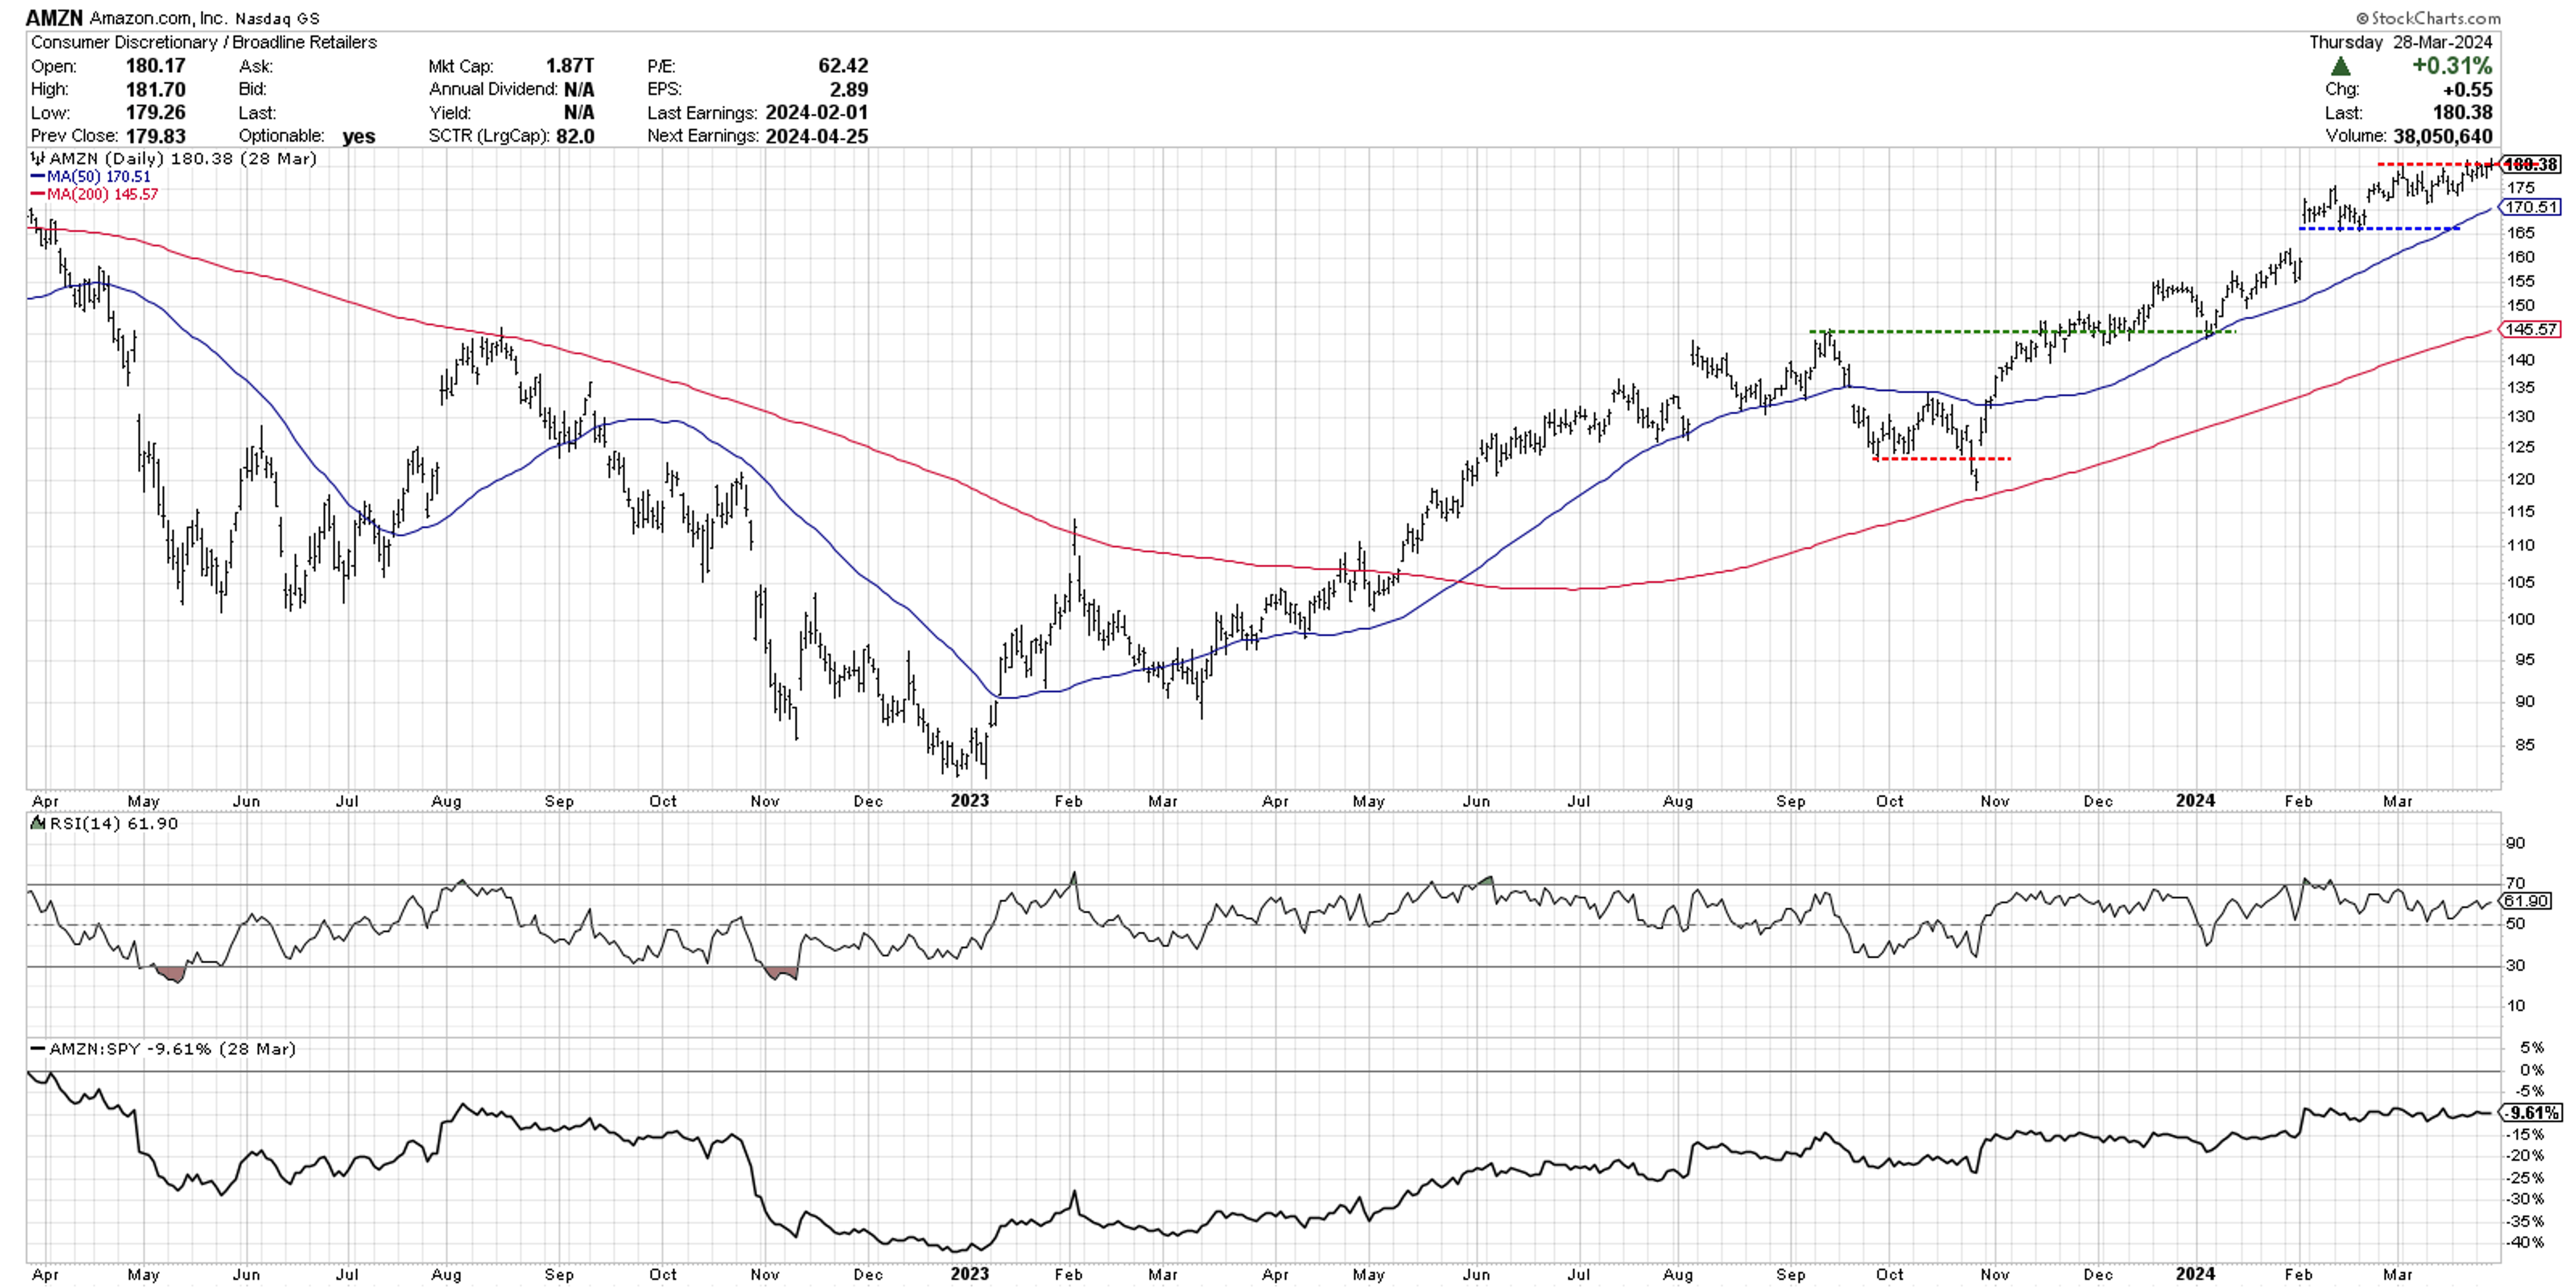
Amazon.com, Inc. (AMZN)
Here we have the first chart that actually made a new 52-week high to finish this shortened holiday week. AMZN has perhaps the most consistent uptrend, with a stepwise motion of higher highs and higher lows since the October 2023 low. The RSI remains strong but not excessive, indicating that further upside potential is very much a possibility.
Microsoft Corp. (MSFT)
We’re now at five straight charts with a bearish momentum divergence. Can you see why I’ve been skeptical of further upside for the Nasdaq 100, given these persistent signs of weakening momentum? Despite the downward-sloping RSI, MSFT remains firmly trending up above an upward-sloping 50-day moving average, which served as short-term support in January and March.

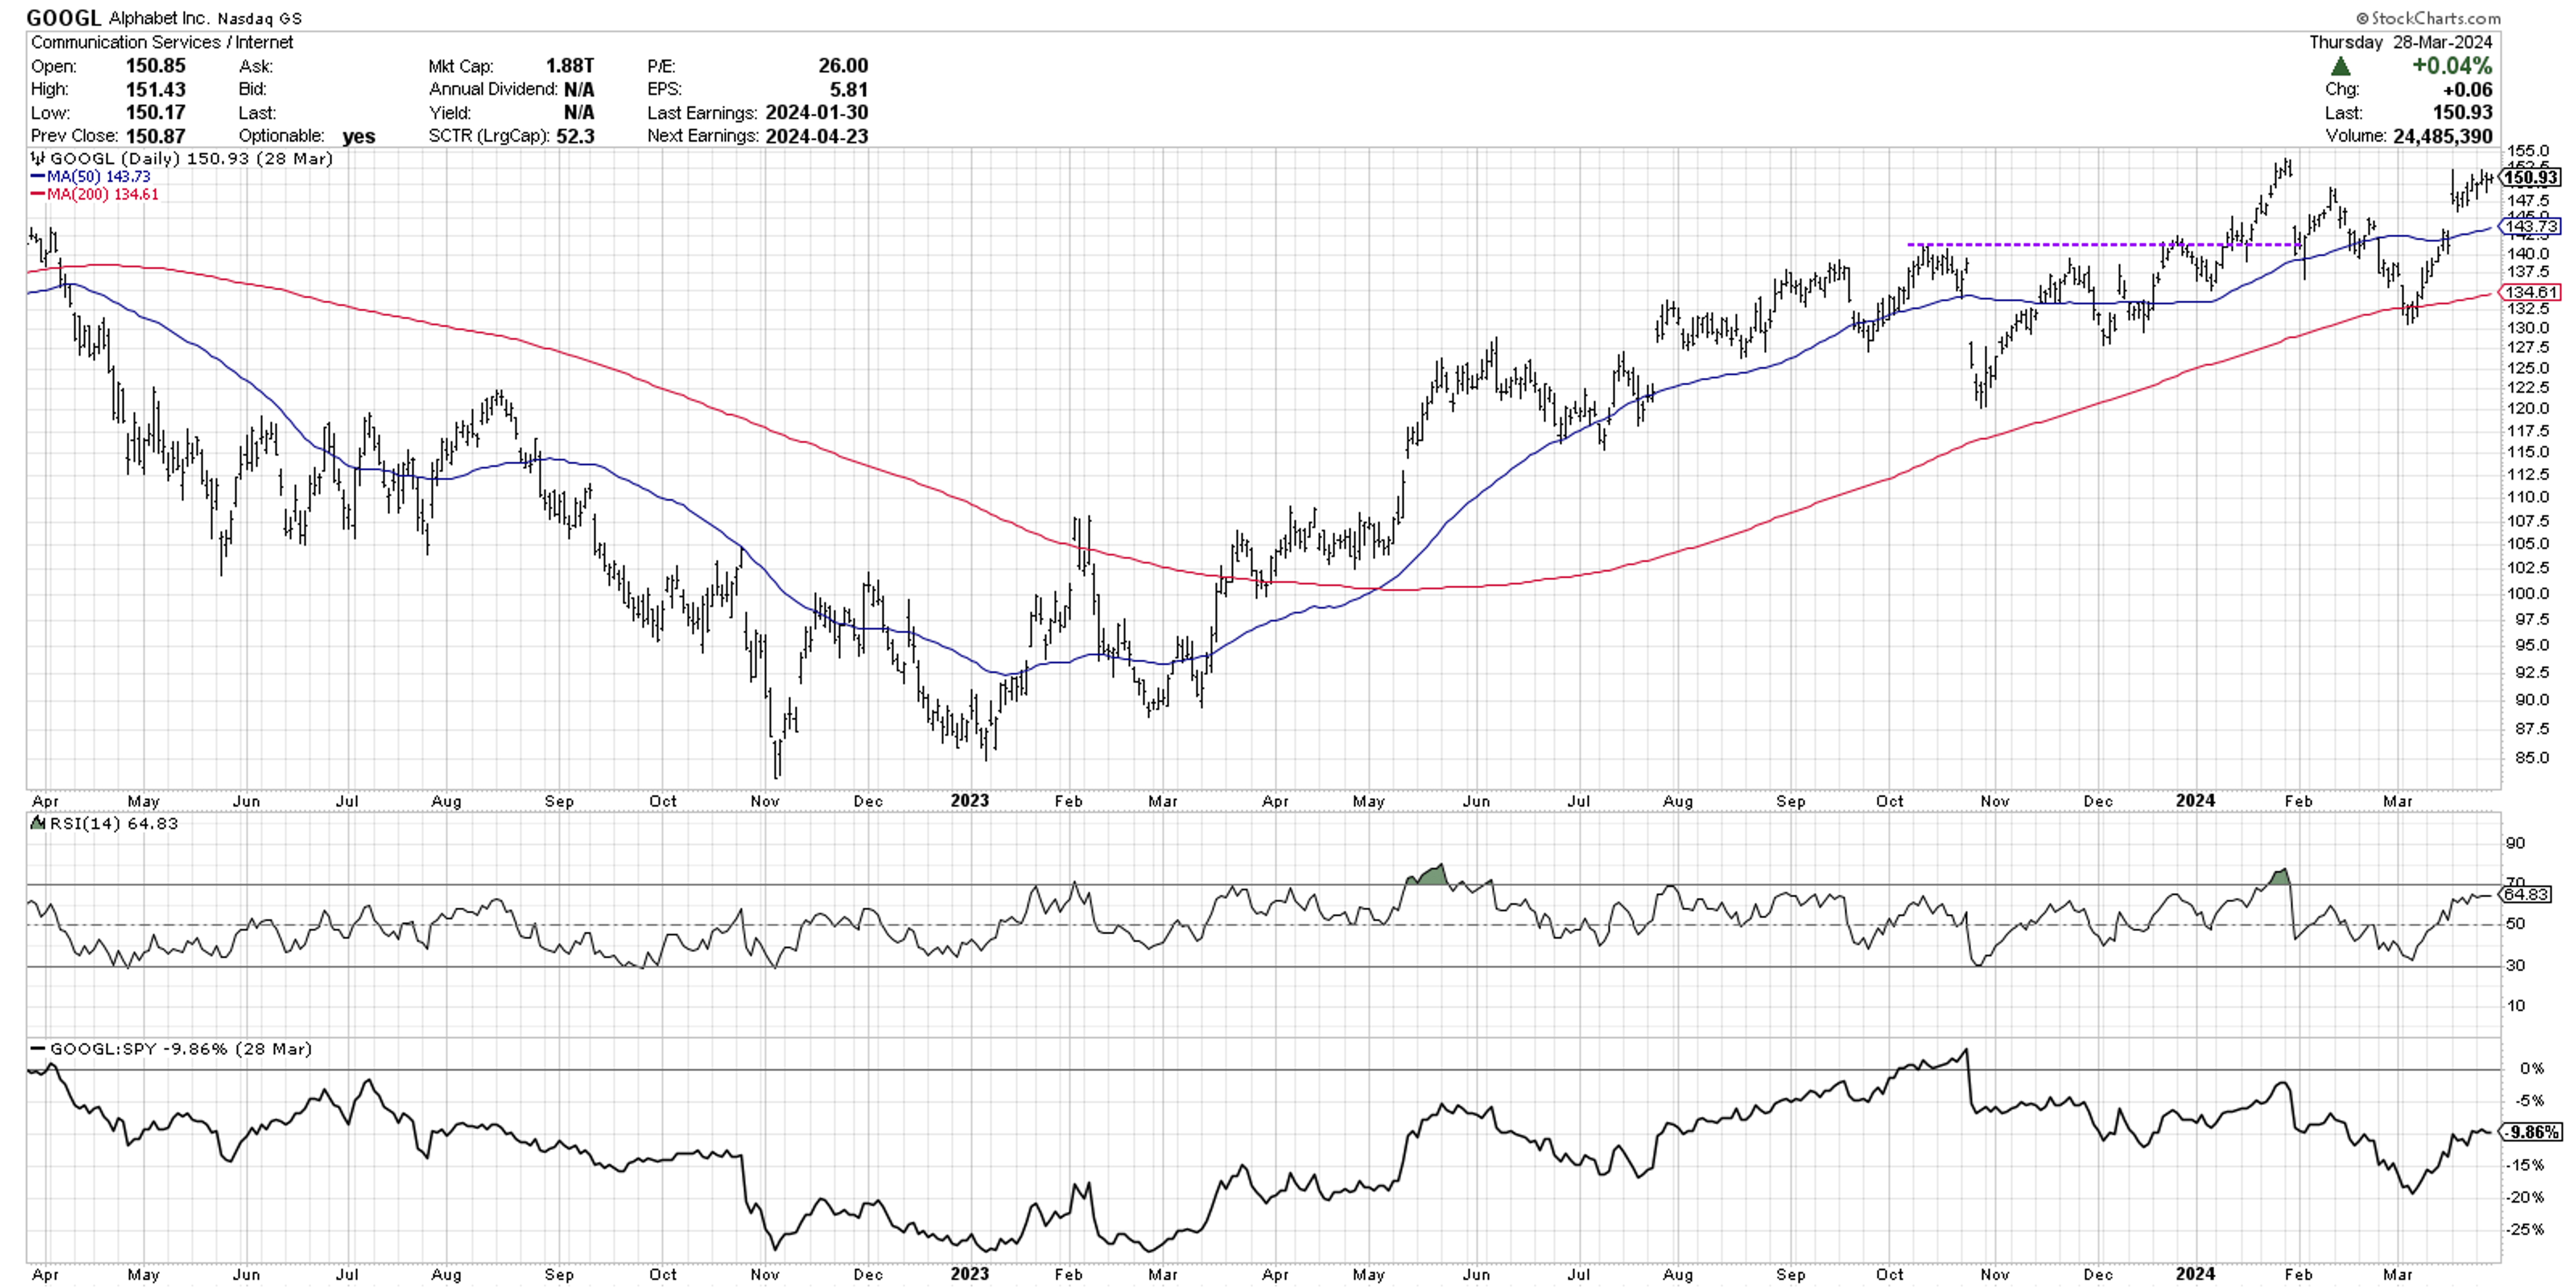
Alphabet Inc. (GOOGL)
Here is where we start to see some differentiation between these leading growth names. Alphabet gapped higher in mid-March, and has seen additional upside since that price gap. Now we are observing a retest of all-time highs around $154. Will this second attempt to breakout above the $155 actually succeed? GOOGL has broken its 50-day moving average in 2024, and actually tested the 200-day in early March before bouncing higher.
Apple, Inc. (AAPL)
With AAPL, we’re now getting to the weakest of the group in terms of their 2024 performance. Apple scores a 9.1 in the large cap SCTR rankings, meaning it’s in the bottom 10% of US large cap stocks as ranked by their trends. This chart is currently testing price and Fibonacci support, and a break below this key support could open the door to further downside for AAPL.

Tesla Inc. (TSLA)
If you’re looking for classic example of a stock in a confirmed downtrend, look no further than TSLA. Here we can observe lower highs and lower lows, price below two downward-sloping moving averages, and RSI consistently below the 50 level. TSLA even broke below Fibonacci support earlier in March. A vote for Tesla would be an optimistic leap of faith on a name that certainly not impressed in Q1.

There are your eight stocks, with a brief technical analysis summary of each chart. Which stock do you see as the best opportunity in Q2, and why? Watch the video below, then drop a comment with your vote and your reasoning!
RR#6, Dave
PS- Ready to upgrade your investment process? Check out my free behavioral investing course!
David Keller, CMT Chief Market Strategist StockCharts.com
David Keller, CMT is Chief Market Strategist at StockCharts.com and President of Sierra Alpha Research LLC, where he helps investors make better decisions using behavioral finance and technical analysis. Dave is a CNBC Pro Contributor, and he recaps market activity and interviews leading experts on his show "The Final Bar" on StockCharts TV. Dave is a Past President of the CMT Association, a global nonprofit organization of technical analysts, and was formerly a Managing Director of Research at Fidelity Investments. David is a classically trained musician and student pilot, and resides in Duvall, WA with his wife and two children. You can follow his thinking at marketmisbehavior.com, where he explores the relationship between behavioral psychology and the financial markets.
Disclaimer: This blog is for educational purposes only and should not be construed as financial advice. The ideas and strategies should never be used without first assessing your own personal and financial situation, or without consulting a financial professional.
The author does not have a position in mentioned securities at the time of publication. Any opinions expressed herein are solely those of the author and do not in any way represent the views or opinions of any other person or entity
This article is from an unpaid external contributor. It does not represent Benzinga's reporting and has not been edited for content or accuracy.
© 2025 Benzinga.com. Benzinga does not provide investment advice. All rights reserved.
Trade confidently with insights and alerts from analyst ratings, free reports and breaking news that affects the stocks you care about.

