Crude Oil False Breakout Strategy Backtest (2010–2024): Code, Filters & Optimization Guide
In this article, we'll explore a trading technique that isn't widely known but is certainly worth examining: the false breakout strategy, also known as the "Fade Breakout." This strategy takes advantage of situations where the market initially seems poised to break through key price levels—such as highs or lows, or support and resistance—but then abruptly reverses direction and continues moving in the opposite way.
Based on these assumptions, we're going to test whether a market typically known for trend-following behavior—like the Crude Oil Future (@CL)—could also present profitable opportunities using this kind of mean-reverting logic.
Fade Breakout Strategy Setup: Rules & Code for Crude Oil Futures
Let's define the rules of this simple strategy.
We'll open a short position if, after breaking above the previous day's high (Highd(1)), prices drop back below that level in the very next bar.
Conversely, we'll open a long position if, after breaking below the previous day's low (Lowd(1)), prices rise back above that level in the next bar.
Here's the basic code that captures this logic:
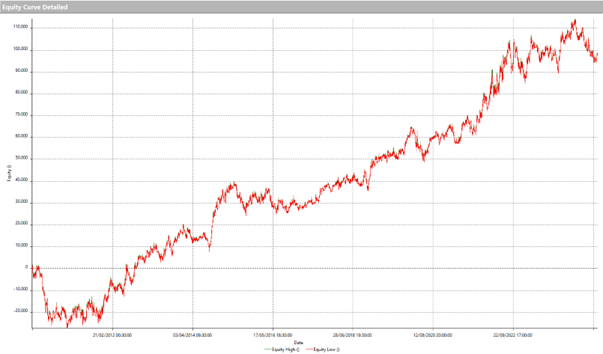
The system operates on 30-minute bars and closes all positions at the end of the trading day—unless a $1,500 stop loss is triggered. Figure 1 shows the equity curve for the strategy applied from 2010 through 2024.
Figure 1 – Backtested Equity Curve of the Crude Oil False Breakout Strategy (2010–2024)
Figure 2 – Performance Metrics: Crude Oil Intraday Strategy Without Filters
The metrics already appear interesting, with a steadily rising equity curve across the full historical range. However, the average trade—at just $33—is still too low. This could be improved by adding filters to reduce the number of trades, which currently sits around 3,000.
Likewise, the maximum drawdown of $29,000 is too high for an intraday system and needs to be reduced. Still, considering these results come from only a few lines of code, the foundations for a promising strategy are certainly present.
Improving Strategy Performance: Volume Filters for False Breakouts
So, what's the next step in improving this system? What kind of filter would make sense here?
Let's not forget what drives our entry logic: we're entering after a failed breakout attempt—presumably because the market lacked the strength to break through a certain level. What if we tried to measure this strength using volume?
Let's add volume as a filter. A trade will now only be executed if there's been a false breakout and the volume in the breakout bar is lower than the average volume over a defined number of bars, specified by the input "vol_len".
We'll run an optimization on "vol_len", ranging from 2 to 20 with steps of 1.
Below is the updated code with the volume filter applied:
Figure 3 – Optimization Results for Volume Filter Input "vol_len"
Figure 4 – Improved Trade Metrics After Adding Volume Filter (vol_len = 15)
Choosing a value of 15 for vol_len significantly reduces the max drawdown from $29,000 to around $17,000 and nearly doubles the average trade from $33 to $64. This is due to the number of trades being cut from 2,989 to 1,319.
So, volume is indeed a meaningful and helpful indicator for our strategy. Intuitively, low-volume breakout attempts are more likely to fail, leading to a reversal—at least in the short term.
Figure 5 – Chart Example of a Long Entry
Stop Loss & Profit Target Optimization to Increase the Average Trade Value
Let's now move on to the next level of our analysis by taking a look at the optimal Stop Loss and Profit Target values. Up until now, we've used a fixed Stop Loss of $1,500 and haven't set any monetary profit target to close the position, other than the session close at 5:00 PM.
So, we'll optimize the "MyStop" and "MyProfit" inputs—setting the former in a range from 1000 to 1800 with a step of 100, and the latter from 0 to 3000, also with a 100 step.
As for the Stop Loss, we'll choose a value of $1,400, and for the Profit Target, we'll go with $1,800, since this setup allows us to increase our average trade to $78 with a net profit of approximately $104,000.
Figure 6 – Stop Loss & Profit Target Optimization Ranges
Figure 7 – Strategy Results After Stop Loss and Profit Target Optimization
Advanced Filtering: Using Price Patterns to Improve Strategy Reliability
At this stage of development, we have a trading system that is definitely interesting but still not ready for live trading or capable of handling the associated costs. So we proceed with additional testing—for example, using our proprietary pattern lists to check whether certain price configurations can help further filter the system. We then optimize accordingly.
One particularly promising pattern is Pattern No. -8. When applied, it allows entry into a position only if the distance between the current session's open and low is not greater than the same distance measured in the previous session, multiplied by a specific coefficient. Essentially, prices must not have dropped beyond a certain threshold; otherwise, the trade is blocked.
Given the improvements it brings, we decide to implement it: the net profit rises to $110,720, the drawdown decreases from $15,700 to $12,750, and the average trade increases from $78 to $98.
Figure 8 – Pattern Optimization Results
Figure 9 – Refined Equity Curve After Applying Pattern Filter
Figure 10 – Final Performance Summary: Crude Oil False Breakout Strategy with All Filters Applied
Conclusion: Is the False Breakout Strategy Worth Using on Crude Oil Futures?
We've reached the end of this article, and now it's your turn to take this system further—perhaps by using other pattern libraries from Unger Academy to filter and refine the most profitable trades.
Until next time, happy trading!
© 2026 Benzinga.com. Benzinga does not provide investment advice. All rights reserved.
To add Benzinga News as your preferred source on Google, click here.