
When stock market forecasts are cloudy, and investors are more bearish than bullish, it may be tempting to accumulate shares at a lower price. But there’s always the chance that the market could go lower. So, what do you do?
One of the best ways to make sense of the stock market is to look at a daily chart of a broad index such as the S&P 500. What is the chart showing you?
If you look at the chart below, you should first notice that there’s been a change since late July 2023. From October 2022 to July 2023, the S&P 500 was making higher highs and higher lows. But since then, it’s been displaying a pattern of lower highs and lower lows. And this scenario, based on basic Dow Theory, indicates the market is trending lower. The index is trading below its 50-day moving average, and the uptrend line has been broken. In short, the primary trend is down.

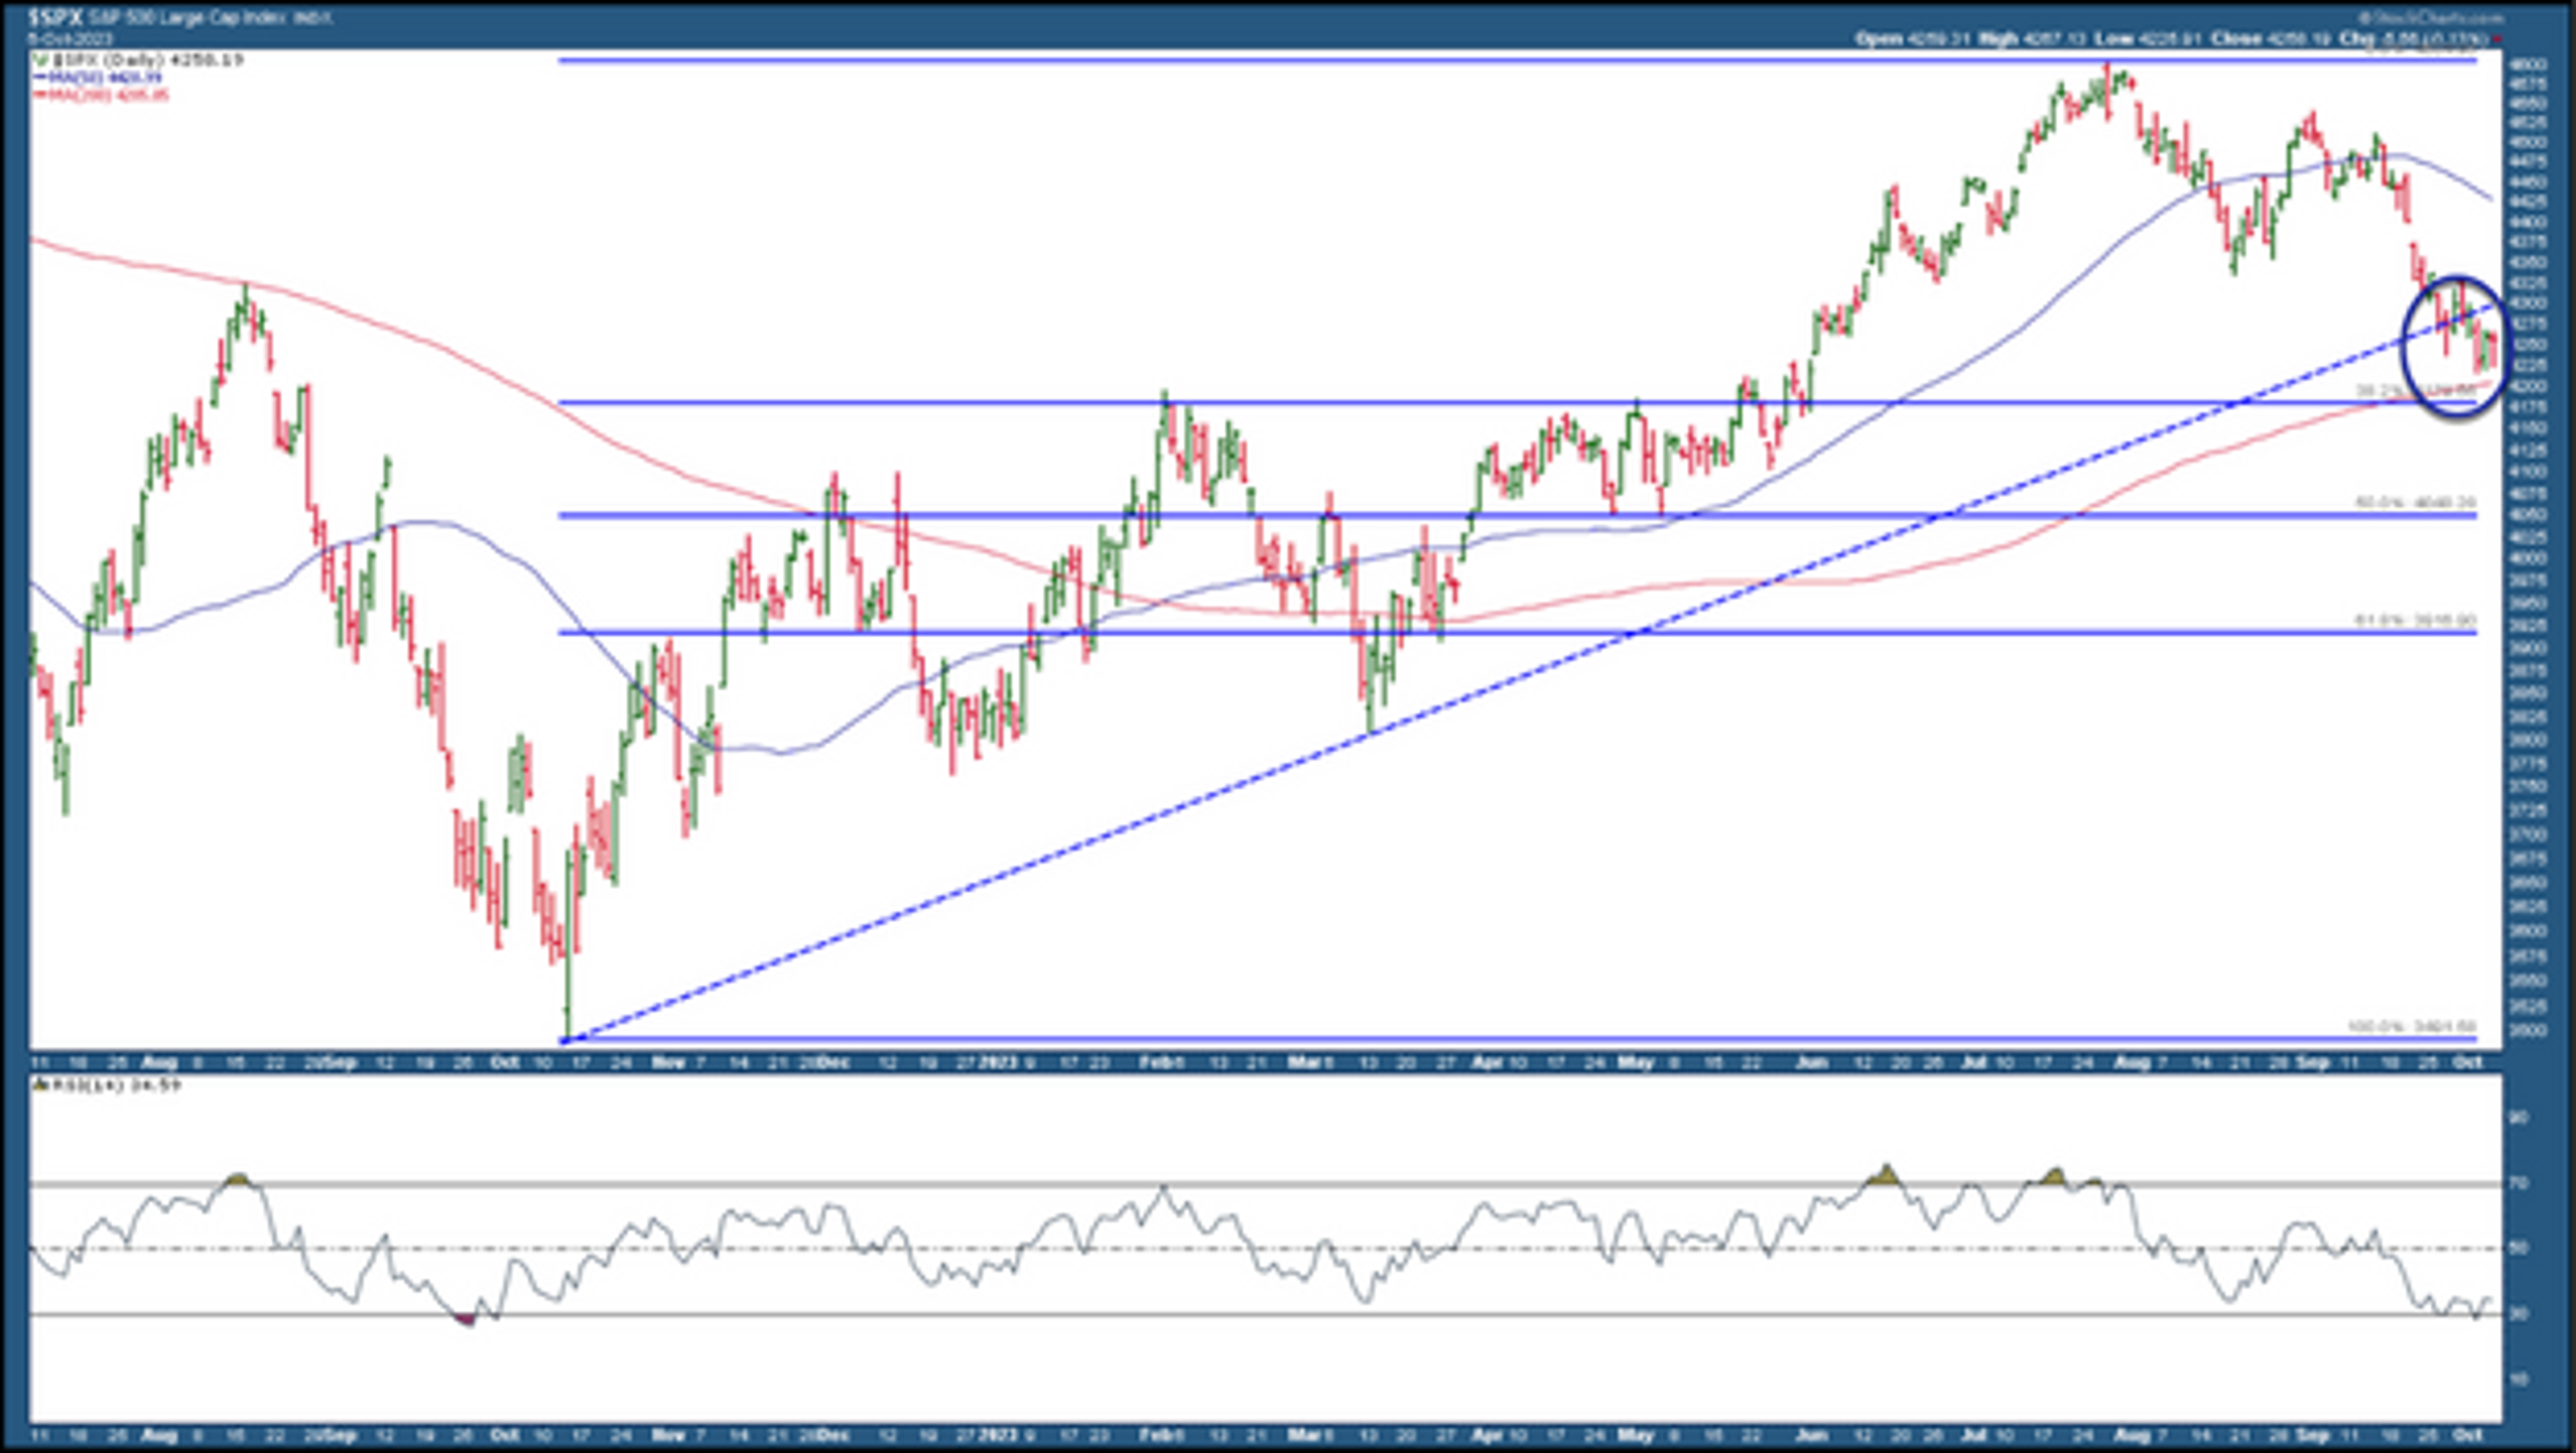
Chart source: StockCharts.com
How Much Lower Can the Market Fall?
I prefer to watch pure price action, especially at key support or resistance levels. In the above chart of the S&P 500, the 200-day moving average almost coincides with the first Fibonacci support level (from the October 2022 low to the July 2023 high). This is a key level to watch. The S&P 500 is close to that support level of around 4200. If the index goes below this level, continues lower, and breaks below 4000, there’s the possibility of further deterioration.
Again, you never know how much lower the market will go. But, if you observe price action, especially at critical support levels, you’ll see indications of a stock market bottom.
Signs Of A Market Reversal
Pinpointing market reversals isn’t an exact science. You need to work with probabilities, which can be skewed depending on the charts you look at. I find market breadth indicators powerful since they are equal-weighted market measures. The broader indexes tend to be weighted—the more heavily weighted components of the index influence its direction. Breadth indicators, on the other hand, remove the “overweightness” and are a true representation of what’s happening to the stocks that make up the indexes. There are several breadth indicators, and deciding which ones to use can be daunting. I prefer to look at advance-decline lines, the percentage of stocks trading above different moving averages, and the McClellan Oscillator.
Charts To Watch
Advancers vs. Decliners. To get an overall view of how different types of stocks are performing, I like to look at the advance-decline lines of the NYSE, S&P 500, S&P mid-caps, and S&P small caps. The chart below displays the four advance-decline lines against the S&P 500 Index.

Chart source: StockCharts.com
All four of the advance-decline lines are trending lower and are below their 50-day simple moving average. When all four charts indicate weakening market breadth, it’s a no-brainer—be patient and look for market breadth to strengthen. Right now, there’s no indication of any signs of a bottom.
Percentage of stocks trading above a moving average. The charts of the percentage of S&P 500 stocks trading above their 50- or 200-day moving averages show a similar picture. They are at low levels, and from past price action, these lines can stay at low levels for an extended period. Still, they can show signs of capitulation, which I’m not seeing yet.

Chart source: StockCharts.com
McClellan Oscillator. One breadth indicator that responds relatively quickly to market conditions is the McClellan Oscillator. When the indicator is above zero, it indicates bullish conditions. Conversely, when the indicator is below zero, it indicates bearish conditions. In the chart below, the oscillator is at around -50. It still has a ways to go before hitting the zero level (horizontal line).

Chart source: StockCharts.com
If past action is any indication, you can see that the McClellan Oscillator moves above the zero level in the early stages of a recovery. So, look for the indicator to break above zero. It could be the signal you are patiently waiting for.
The Bottom Line
Stock market breadth conditions are negative. But if you keep an eye on the breadth indicators such as advance-decline lines, percentage of stocks in an index trading above important moving averages, and the McClellan oscillator, you’ll be able to identify when the stock market has bottomed and when a reversal is likely to occur.
© 2025 Benzinga.com. Benzinga does not provide investment advice. All rights reserved.