
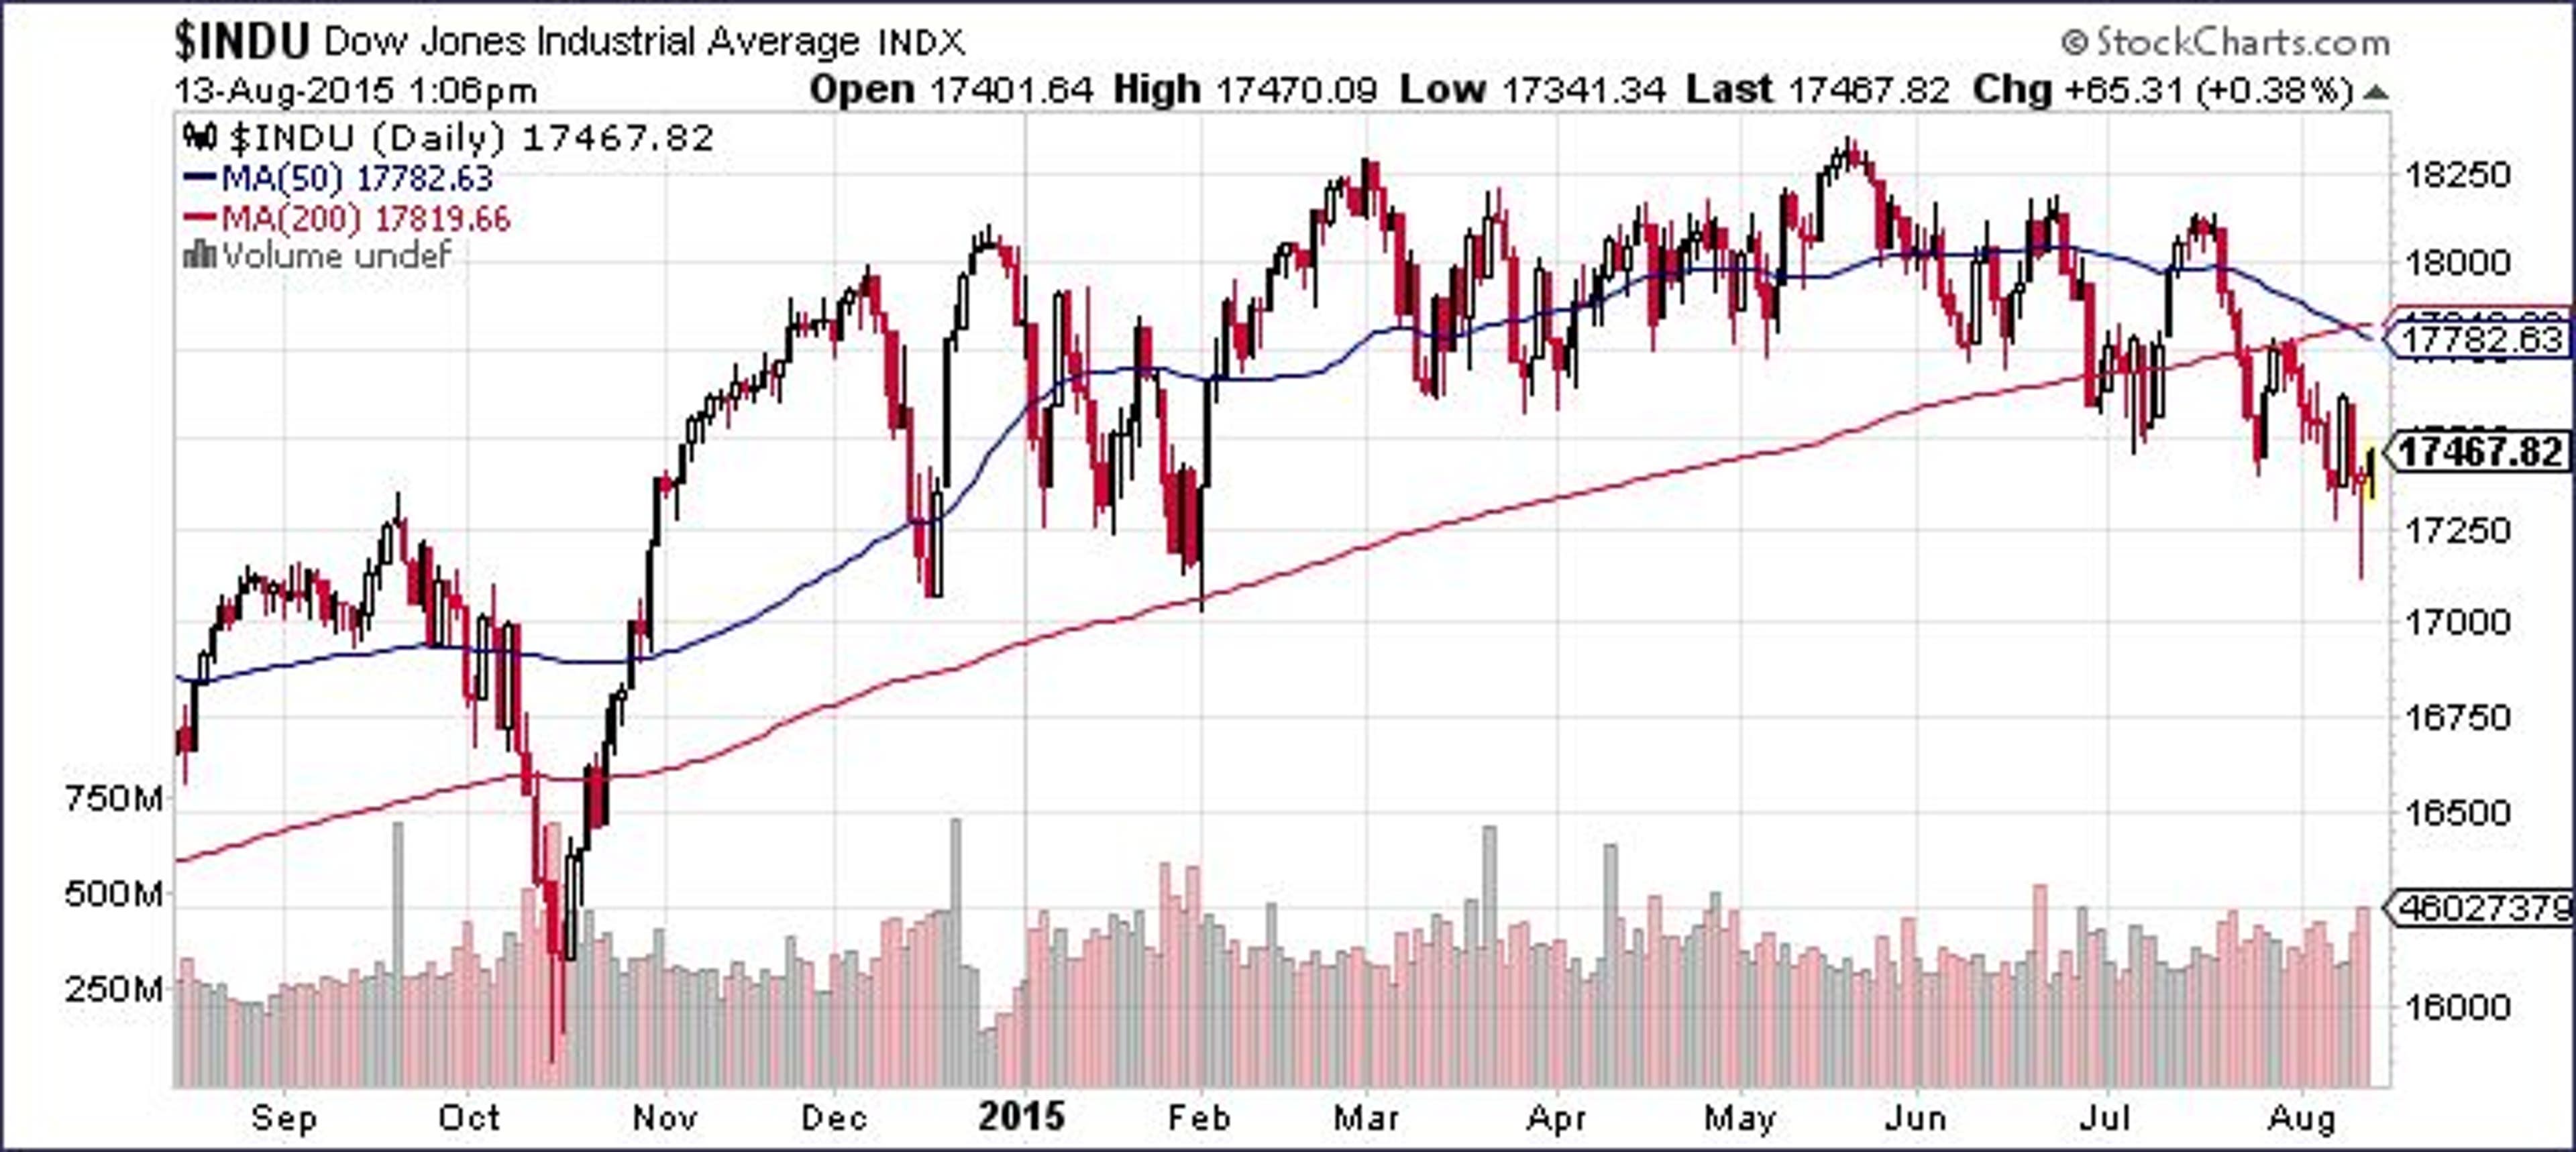
The Dow Jones Industrial Average got a lot of press this week after it succumbed to its first traditional “death cross” since 2011 when the index’s 50-day simple moving average (SMA) crossed below its 200-day SMA. Technical traders often view this crossover as a bearish long-term technical signal, but traders that sold the index and its components at the time of the cross sold the Dow following a drop of about 3.5 percent in less than a month.

The Concept Of Crossovers
The idea behind trading crossovers is that a short-term moving average above a long-term moving average is an indicator of upward momentum in a stock, and the opposite is true about a short-term average trading below a long-term average. This second scenario played out with the Dow this week when the 50-day SMA crossed below the 200-day SMA.
Are There Better Numbers?
The 50-day and 200-day SMAs are conventionally used in determining crossovers, but are they the best averages to trade? ETF HQ tested a massive number of combinations of moving averages to determine which two averages generated the highest crossover trading returns.
They used a total of 300 years worth of daily and weekly data from 16 different global indices to determine which two moving averages would have produced the largest gains for crossover traders.
The Results
First, ETF HQ found that exponential moving averages (EMAs), which weight most recent prices heavier than earlier prices, perform better overall than SMAs, which weight all prices in the timeframe equally.
Among short- and long-term EMAs, they discovered that trading the crossovers of the 13-day and 48.5-day averages produced the largest returns.
Buying the average 13/48.5-day “golden cross” produced an average 94-day 4.90 percent gain, better returns than any other combination.
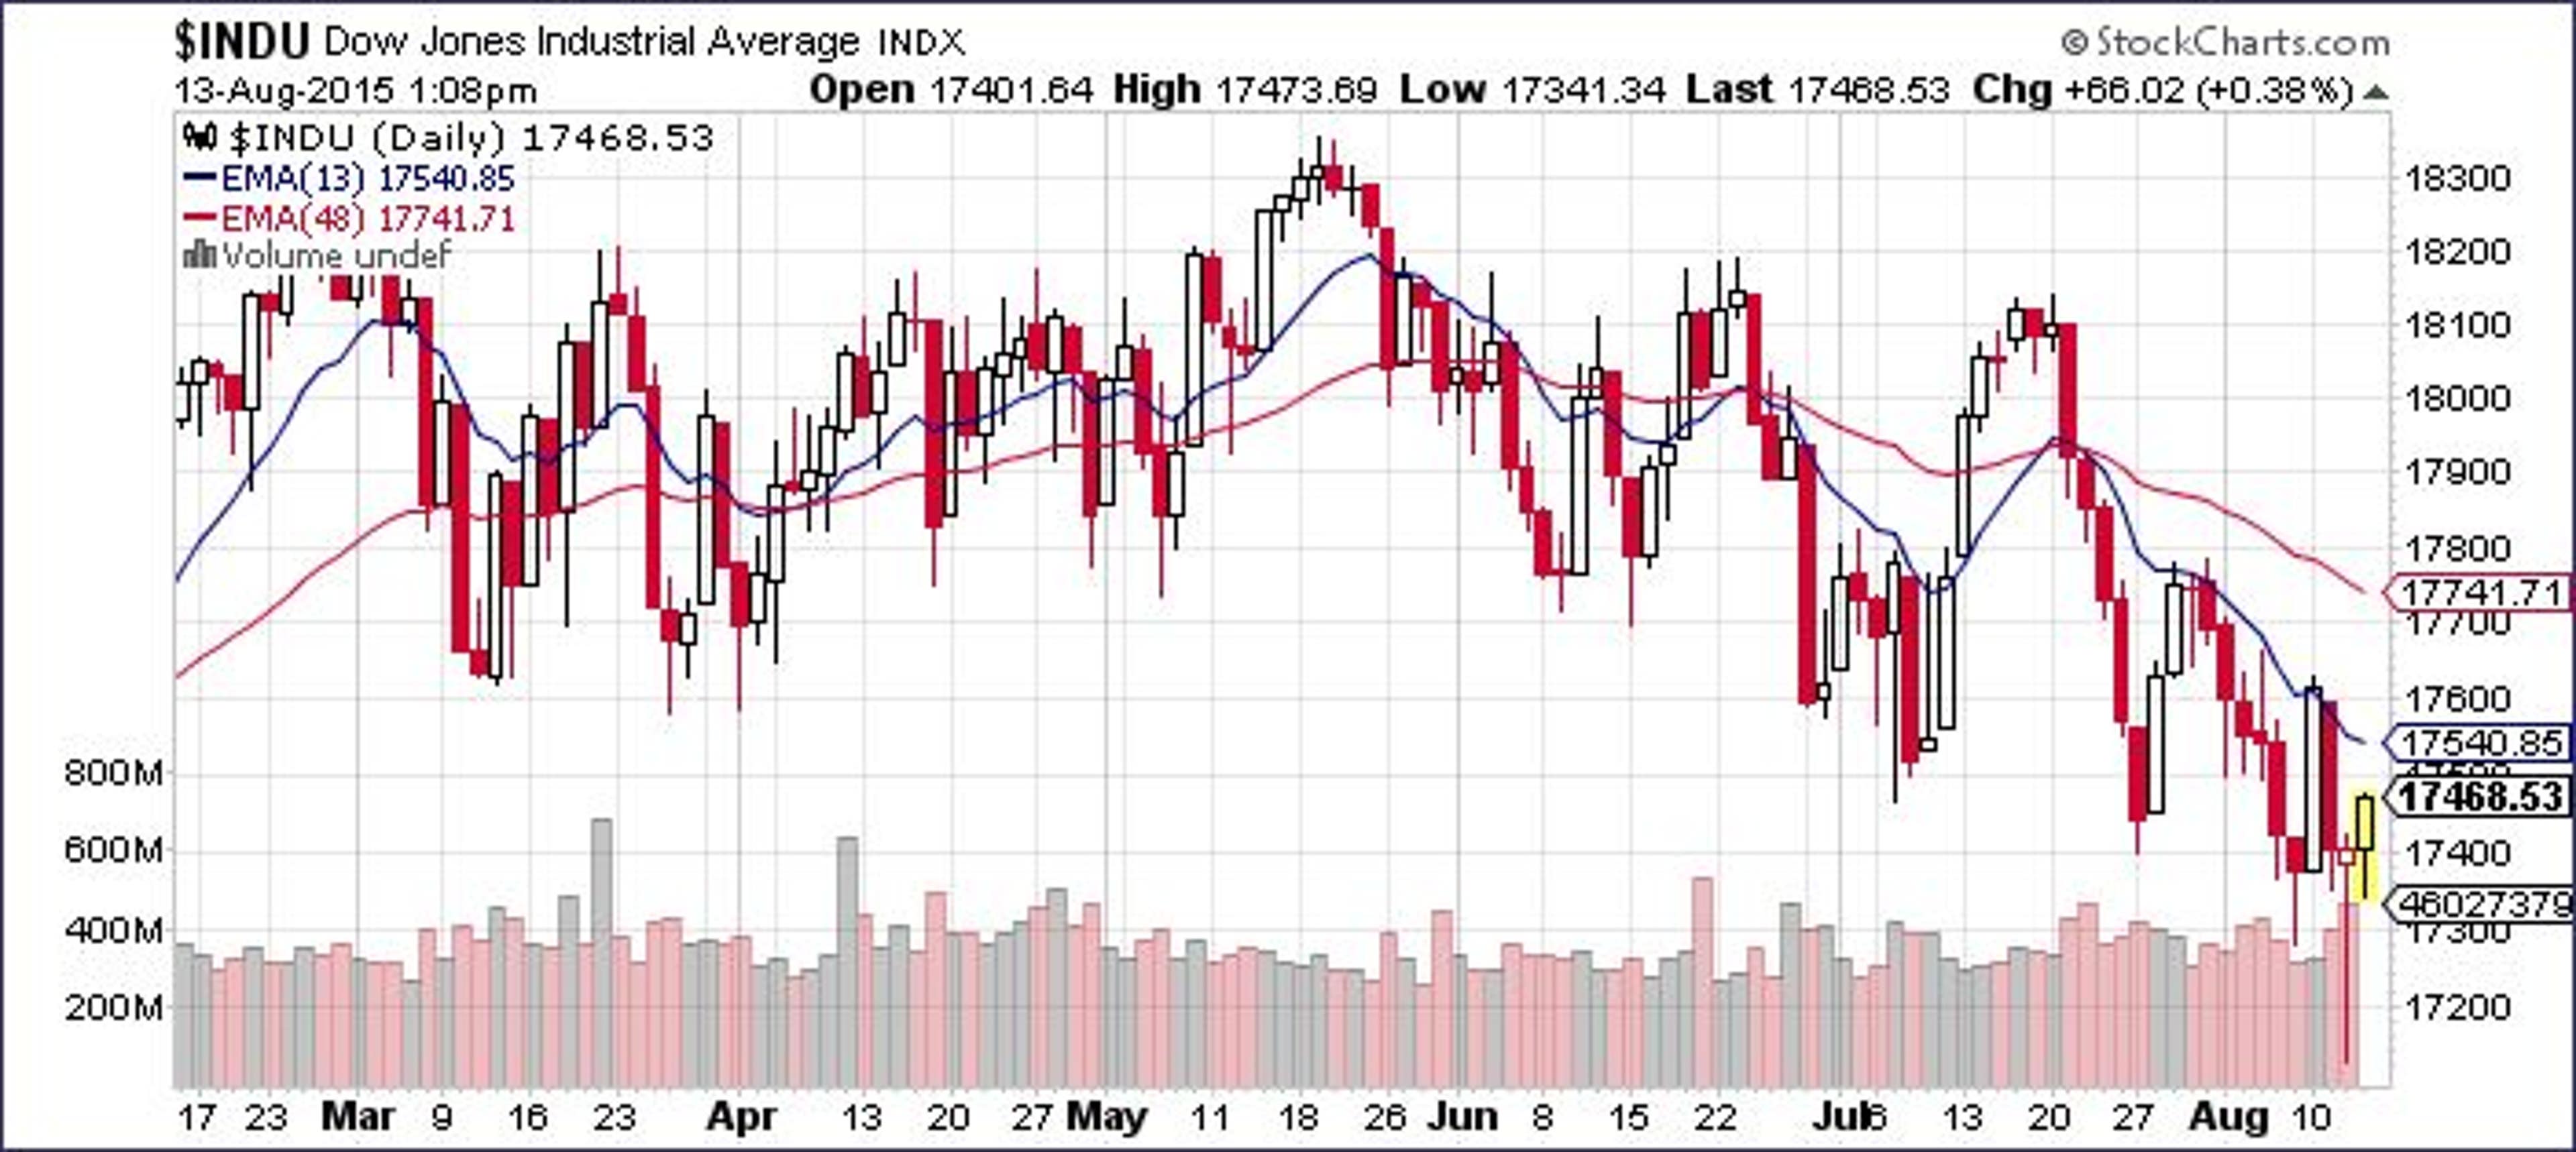
It’s interesting to note that traders using this strategy would have sold the Dow in mid-June when it was trading around 17875, nearly 400 points higher than it was trading at the time of its 50/200-day SMA death cross earlier this week.
© 2025 Benzinga.com. Benzinga does not provide investment advice. All rights reserved.