
The SPDR S&P 500 (NYSE:SPY) opened higher Thursday before running into a group of sellers who knocked the market ETF down to near flat.
The SPY has been consolidating since Feb. 3, and over the last three trading days, the ETF has printed a double inside bar pattern on the daily chart, with all of Wednesday’s and Thursday’s price action taking place within Tuesday’s trading range.
The pattern leans bullish in this case, as the SPY was trading in a fairly consistent uptrend before entering consolidation.
According to an American Association of Individual Investors (AAII) survey, bullish sentiment among individual investors is rising. For the weekly period ending Feb. 8, 37.5% of investors polled are bullish on the stock market over the next six months, while an equal amount are neutral and 25% are bearish.
The number of investors with a bullish outlook has increased from 29.9% for the week ending Feb. 2 and up from 28.4% of those surveyed who were bullish the week ending Jan. 25.
An increasingly dovish tone from Federal Reserve Chair Jerome Powell when he spoke on Feb. 2 following the central bank’s decision to apply a 0.25% rate hike and when he spoke at the Economic Club of Washington on Tuesday likely contributed to the increasingly bullish sentiment.
AAII notes, however, that its sentiment survey is a contrarian indicator. According to its surveys, AAII has found that investors see lower levels of returns following high levels of optimism and higher levels of returns when there is less optimism.
From a technical analysis perspective, it’s not possible to see what may happen over the next six months, but over the short-term, the S&P 500 looks bullish.
Want direct analysis? Find me in the BZ Pro lounge! Click here for a free trial.
The SPY Chart: The SPY crossed above the 200-day simple moving average on Jan. 23, and on Jan. 26 the market ETF burst up through a long-term descending trendline that had been holding it down since Jan. 4, 2022.
The SPY then trended north until Feb. 2, when it topped out at $418.31, just shy of rising the 20% higher from the Oct. 13 low of $348.11 that is needed to call an end to the bear market.
- Since topping out near $418, the SPY has been consolidating under that level, possibly gathering the strength to break up from the Feb. 2 high-of-day. Traders and investors will be watching to see which way the SPY breaks from Tuesday’s mother bar over the next few days to gauge future direction.
- Although the SPY was showing bearish price action on Thursday, the move lower was coming on decreasing volume, which is bullish. Bullish traders would like to see the SPY rally into the end of Thursday’s trading day, which could indicate higher prices or another inside bar could be in the cards for Friday.
- Bearish traders want to see big bearish volume come in and force the SPY down under a support level at $408, which would cause the SPY to close under the eight-day exponential moving average. If that happens, the uptrend could be negated and a downtrend could take place.
- The SPY has resistance above at $414.89 and $420.76 and support below at $408 and $404.

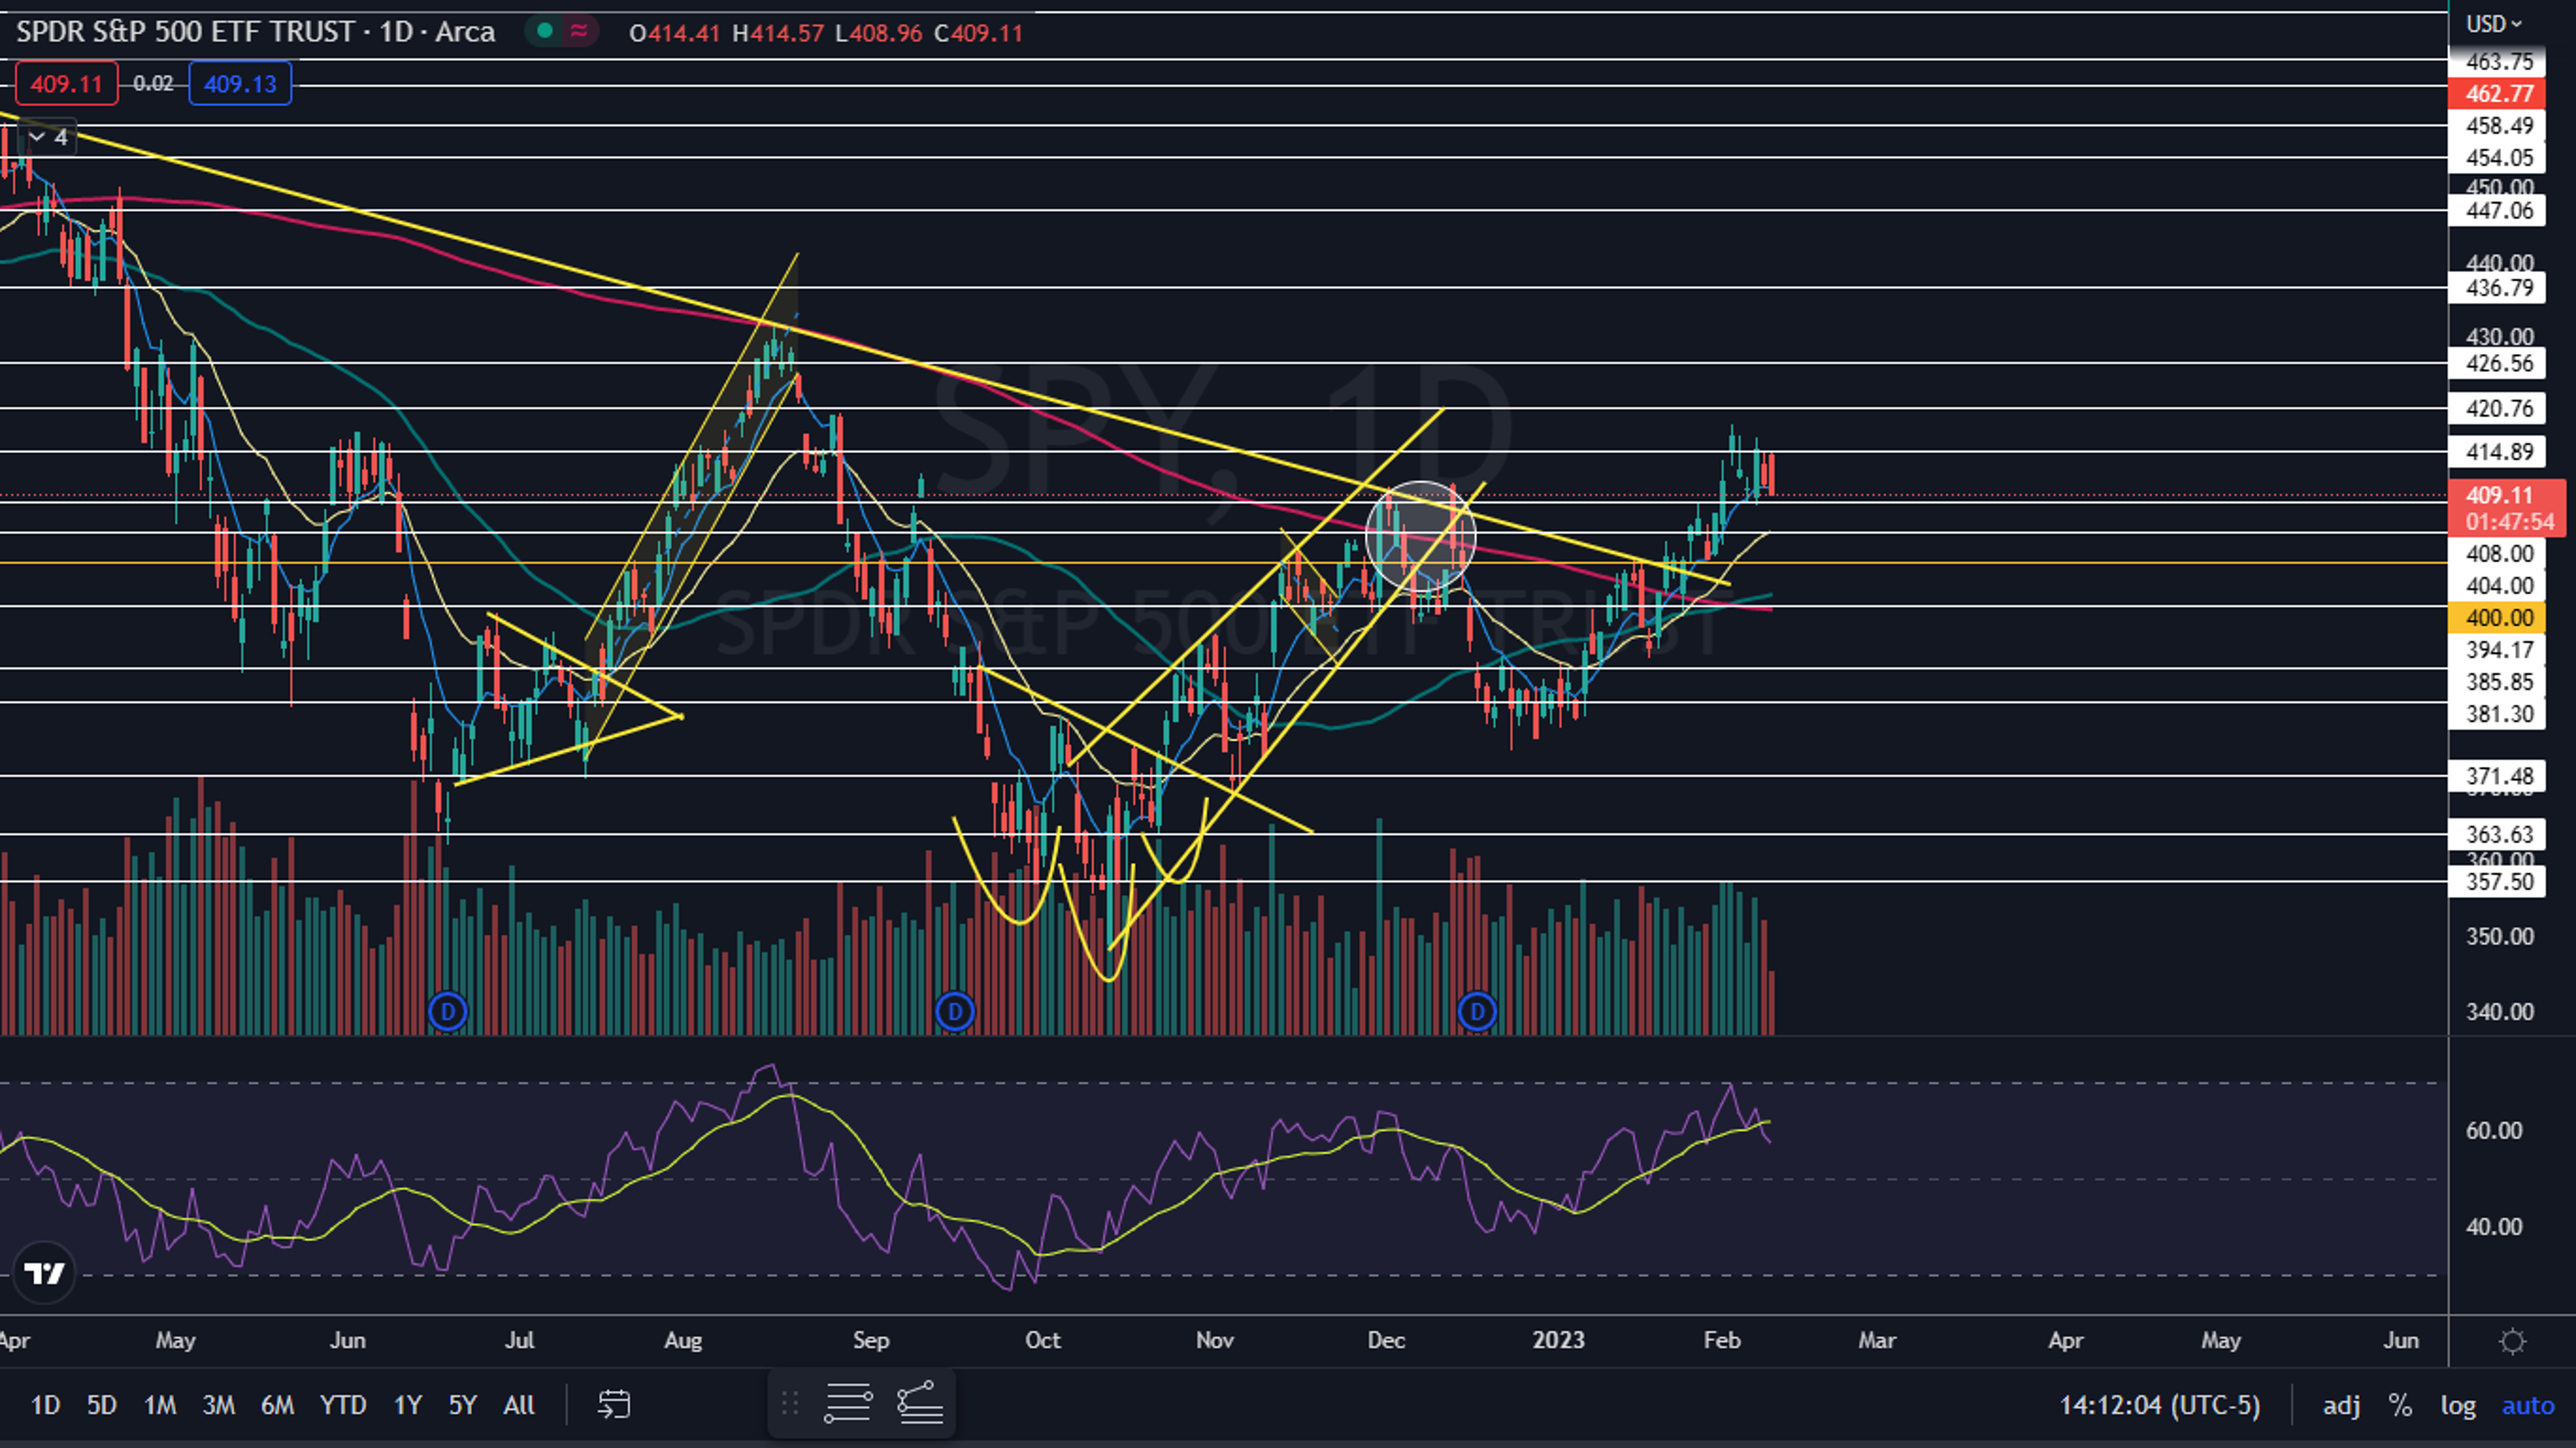
Photo via Shutterstock.
© 2025 Benzinga.com. Benzinga does not provide investment advice. All rights reserved.