


It goes without saying that debt troubles in the eurozone have caused sharp declines and high volatility in equities from the region. The problems here may take a long time to resolve and may remain a drag on global investing for an indeterminate period.
As this is being written Spain and their banks are being pledged a €100 billion bailout. The terms are still murky but it’s leading to some temporary relief. The problem of course is bailouts without reform are just like giving crack to an addict since their likely to be back for more down the road. This puts Moral Hazard issues on the table with Italy perhaps next in line empowered to ask for something similar. For now these measures only “buy time” which is politically expedient.
In another week Greece will hold elections. The change of leaders in France has made more bailouts and stimulus likely. The Greek people as of recent polling data don’t believe in the austerity proposals pointing a finger at Germans who are demanding more reform. And with the new French leader Hollande being more dovish the pressure is mounting on German leader Merkel to cave-in on her strong demands for reform. In sum, it’s a fluid mess.
There is currently an expanding list of 30 ETFs oriented to the European region whether in single country funds or with regional issues. The following analysis features a fair representation of ETFs available. We believe from these investors may choose an appropriate ETF to satisfy the best index-based offerings individuals and financial advisors may utilize.
You will note with many of these ETF issues a lower than desirable level of trading volume and Assets under Management (AUM). Much of this is due to the current crisis in the eurozone as investors by and large steer clear of the region.
ETFs are based on indexes tied to well-known index providers including Russell, S&P, Barclays, MSCI, Dow Jones and so forth.
Where competitive issues exist and/or repetitive issues available at a fee cost saving we mention those as other choices. New issues are coming to market consistently (especially globally) and sometimes these issues will need to become more seasoned before they may be included at least in our listings.
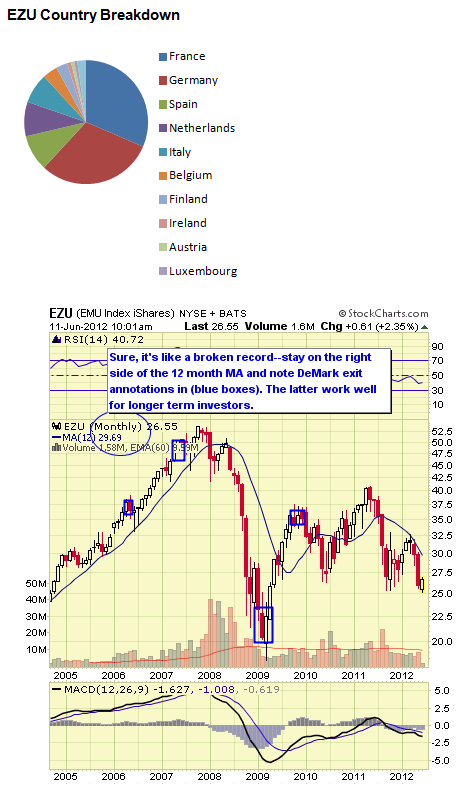
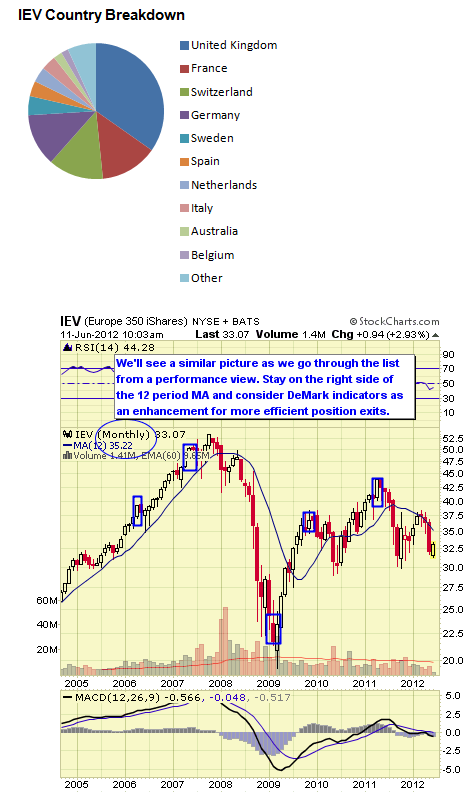
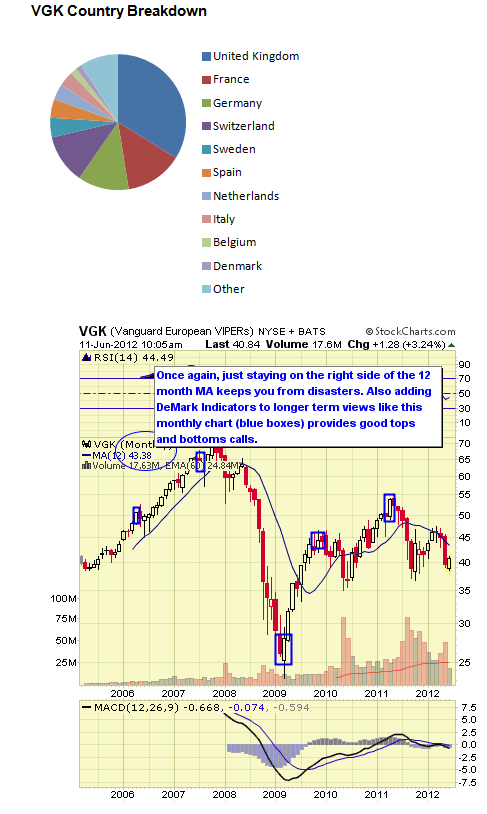
We feature a technical view of conditions from monthly chart views. Simplistically, we recommend longer-term investors stay on the right side of the 12 month simple moving average. When prices are above the moving average, stay long, and when below remain in cash or short.
ETF Digest members receive added signals when markets become extended such as DeMark triggers to exit overbought/oversold conditions.
For traders and investors wishing to hedge, leveraged and inverse issues are available to utilize from ProShares and Direxion and where available these are noted.
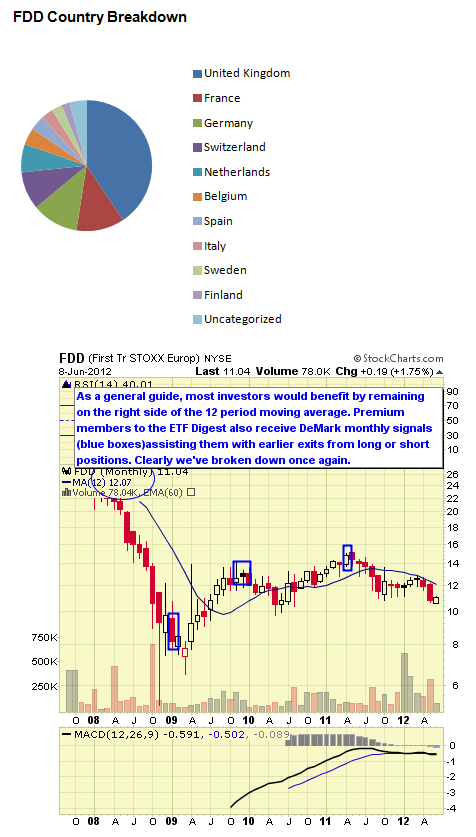
#10: First Trust DJ STOXX Select Dividend 30 ETF FDD


FDD follows the Dow Jones STOXX Select Dividend 30 Index which selects the highest dividend paying stocks from the STOXX 600 Index. The fund was launched in August 2007. The expense ratio is 0.60%. AUM equal $10.5M and average daily trading volume is only 10K shares. As of June 2012 the annual dividend yield was 5.78% and YTD return -6.60%. The 1 YR return was -20.08%.
A note of caution: since the fund has been in existence since 2007 and hasn’t garnered many assets you might wonder if the fund will be successful as it is without being rolled into another fund. I have no basis to know if this would happen but it’s something to consider.
Data as of June 2012
FDD Top Ten Holdings & Weightings
- RSA Insurance Group PLC (RSA): 5.11%
- France Telecom SA (FTE): 4.96%
- Koninklijke (Royal) KPN NV (KPN): 4.70%
- Zurich Insurance Group AG (ZFSVF): 4.38%
- Catlin Group Ltd (CGL): 4.22%
- Belgacom SA (BGAOF): 4.18%
- Provident Financial PLC (PFG): 3.90%
- Sse Plc: 3.84%
- AstraZeneca PLC (AZN): 3.74%
- Banco Santander SA (BCDRF): 3.65%
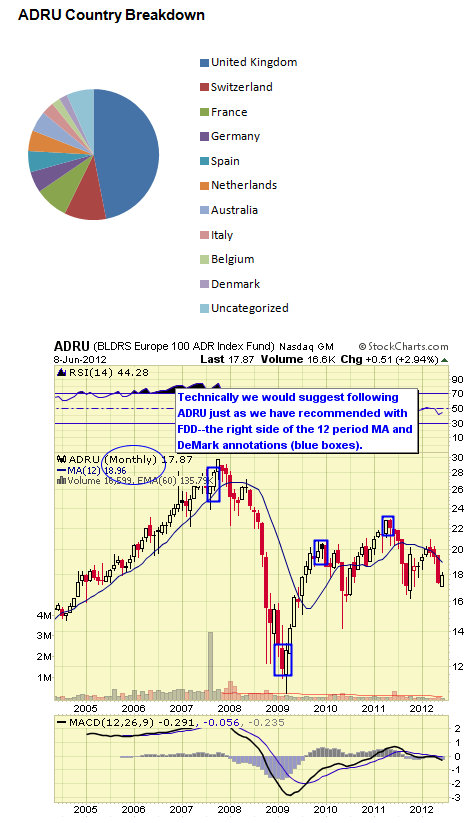
#9: PowerShares BLDRS Europe 100 ADR ETF ADRU
ADRU follows the Bank of New York Mellon Europe 100 ADR Index which contains 100 European depository receipts. The fund was launched in November 2002. The expense ratio is .30%. AUM equal $12.5M and average daily trading volume is less than 2K shares. (This data challenges the survivability of ADRU as a profitable business enterprise for the sponsor.)
As of late June 2012 the annual dividend yield was 3.93% and YTD return -4.08%. The 1 YR return was -16.55%.
Data as of June 2012
ADRU Top Ten Holdings & Weightings
- HSBC Holdings PLC ADR (HBC): 5.58%
- Novartis AG ADR (NVS): 5.00%
- Vodafone Group PLC ADR (VOD): 4.71%
- BP PLC ADR (BP): 4.71%
- Royal Dutch Shell PLC ADR (RDS.A): 4.55%
- GlaxoSmithKline PLC ADR (GSK): 4.09%
- Total SA ADR (TOT): 3.70%
- British American Tobacco PLC ADR (BTI): 3.52%
- Royal Dutch Shell PLC ADR (RDS.B): 3.39%
- Sanofi ADR (SNY): 2.99%
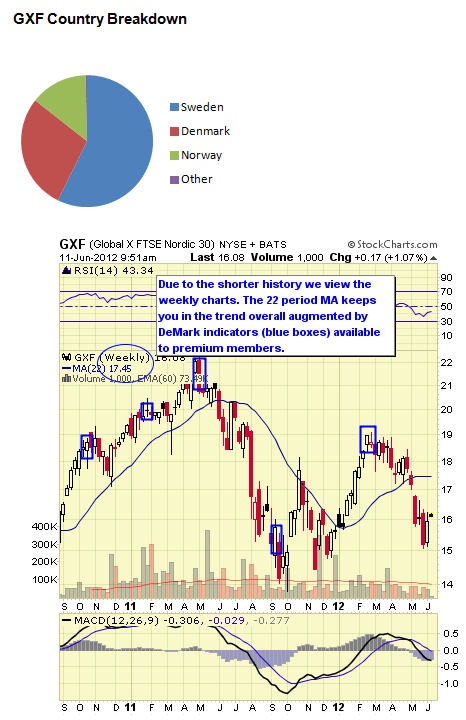
#8. Global X Nordic 30 ETF GXF
GXF follows the FTSE Nordic 30 Index which includes the 30 largest companies in Sweden, Denmark, Norway and Finland. The Fund was launched in August. The expense ratio is 0.50%. AUM equal $22M average daily trading volume is 11K shares. As of June 2012 the annual dividend yield was 3.77% and YTD return 1.73%.
The 1 YR return was –21.37%. GXF trades commission free at E*Trade and Interactive Brokers.
Data as of First Quarter 2012
GXF Top Ten Holdings & Weightings
- Novo Nordisk A/S ADR (NVO): 14.81%
- Statoil ASA ADR (STO): 6.42%
- Ericsson Telephone Company ADR (ERIC): 5.83%
- Nordea Bank AB (NRDEF): 4.95%
- Hennes & Mauritz AB (HM B): 3.80%
- Svenska Handelsbanken (SHB A): 3.77%
- Sandvik AB (SDVKF): 3.55%
- Volvo Corporation (VOLVF): 3.43%
- Swedbank AB (SWED A): 3.35%
- Atlas Copco AB (ATCO A): 3.26%
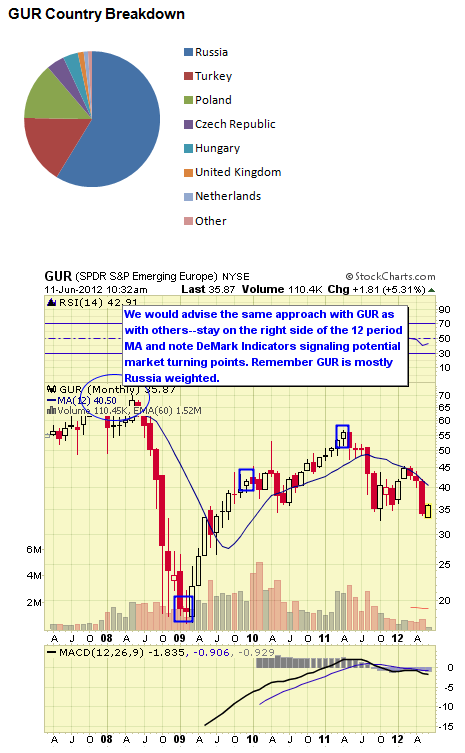
#7: SPDR S&P Emerging Europe ETF GUR

GUR follows the S&P European Emerging BMI Capped Index. The fund was launched in March 2007. The expense ratio is 0.59%. AUM equal $73.8M and average daily trading volume is 25K shares. As of June 2012 the annual dividend yield was 3.98% and YTD return -0.36%. The 1 YR return was -31.20%. GUR trades commission free at TD Armeritrade.
Note: The high weighting in Russia can be a positive or negative depending on your view and market behavior.
Data as of June 2012
GUR Top Ten Holdings & Weightings
- Gazprom OAO ADR (OGZPY): 15.14%
- LUKOIL Oil Company JSC ADR (LUKOY): 7.84%
- Sberbank of Russia OJSC: 6.86%
- Rosneft Oil Company OJSC GDR (ROSN): 4.05%
- MMC Norilsk Nickel JSC ADR (NILSY): 3.73%
- Novatek OAO GDR (NVTK): 3.52%
- Surgutneftegas OJSC ADR (SGTZY): 3.25%
- Turkiye Garanti Bankasi A.S. (GARAN): 2.76%
- CEZ AS (CEZ): 2.59%
- Mobile Telesystems OJSC ADR (MBT): 2.17%
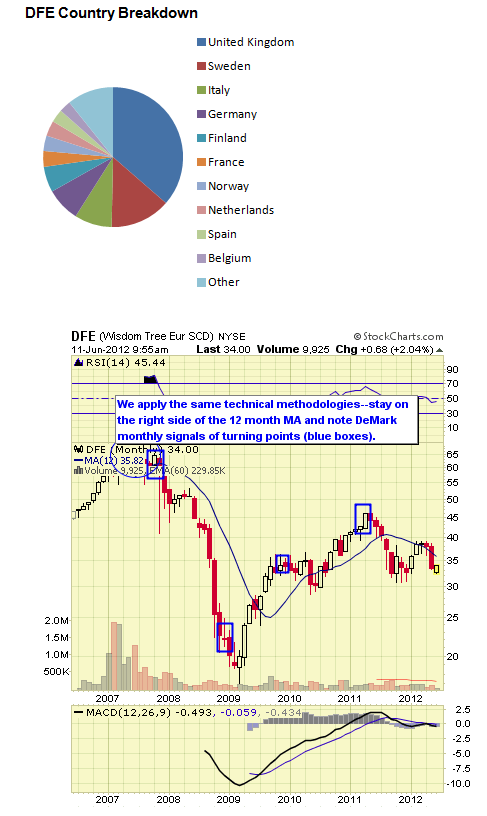
#6: WisdomTree Europe SmallCap Dividend ETF DFE
DFE follows the WisdomTree Europe SmallCap Dividend Index which measures the performance of small cap dividend capitalization segment of the European dividend market and comprises the bottom 25% of stocks in the universe once the top 300 largest companies are removed. The fund was launched in June 2006. The expense ratio is 0.58%.
AUM equal $24.8M and average daily trading volume is 3K shares. As of June 2012 the annual dividend yield was 5.81% and YTD return 3.88%. The 1 YR return was -22.98%. DFE trades commission free at E*Trade.
Data as of June 2012
DFE Top Ten Holdings & Weightings
- De La Rue PLC (DELRF): 1.27%
- Close Brothers Group PLC (CBG): 1.25%
- NCC AB (NCC B): 1.22%
- Greene King PLC (GNK): 1.03%
- Huhtamäki Oyj (HUH1V): 0.90%
- Tieto Corp (TIE1V): 0.90%
- Comdirect Bank AG (COM): 0.88%
- Carl Zeiss Meditec AG (CZMWF): 0.86%
- Antena 3 de Television, S.A. (A3TV): 0.85%
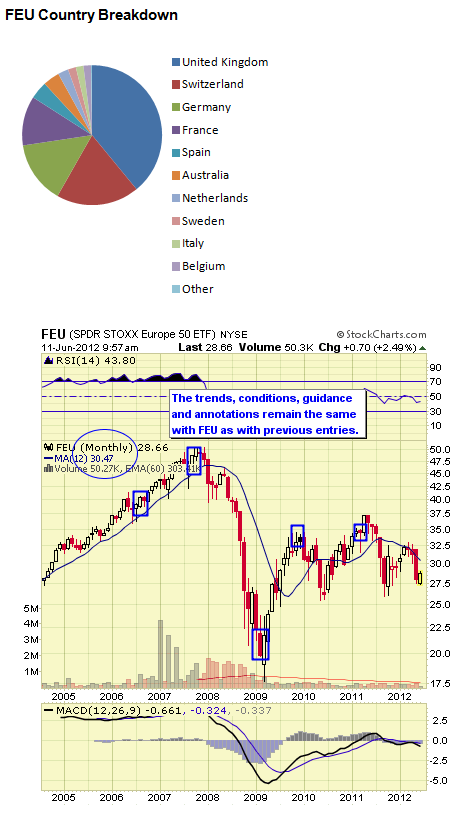
#5. SPDR DJ STOXX 50 ETF FEU
FEU follows the Dow Jones STOXX 600 Total Market Index which covers approximately 95% of the investable universe in Europe. The fund was launched in October 2002. The expense ratio is 0.29%. AUM equal $29.5M and average daily trading volume is 7.5K shares.
As June 2012 the annual dividend yield was 3.64% and YTD return -4.23%. The 1 YR return was -19.87%.
Data as of June 2012
FEU Top Ten Holdings & Weightings
- Nestle SA (NSRGF): 6.39%
- HSBC Holdings PLC (HBCYF): 4.78%
- Novartis AG (NVSEF): 4.64%
- Vodafone Group PLC (VODPF): 4.50%
- BP PLC (BPAQF): 3.90%
- GlaxoSmithKline PLC (GLAXF): 3.88%
- Royal Dutch Shell PLC (RYDAF): 3.85%
- Roche Holding AG (RHHVF): 3.75%
- Total SA (FP): 3.26%
- British American Tobacco PLC (BATS): 3.26%
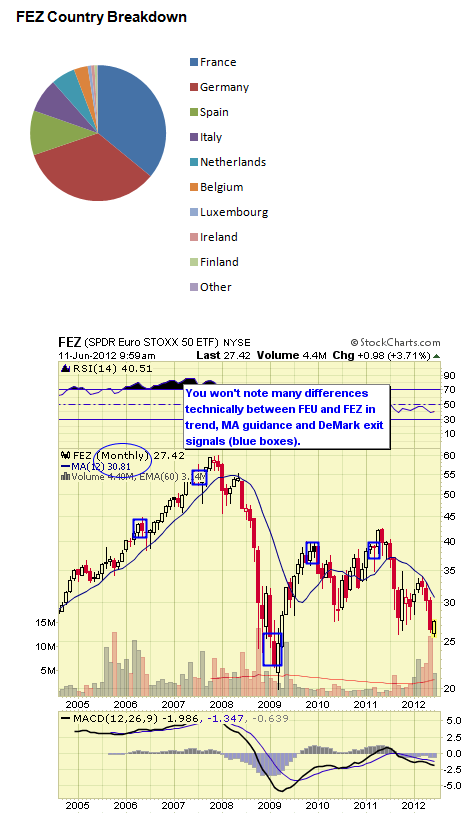
#4: SPDR DJ Euro STOXX 50 ETF FEZ
FEZ follows the Dow Jones EURO STOXX 50 Index which includes 60% of the market capitalization of the Dow Joes EURO STOXX Total Market Index. The fund was launched in October 2002. The expense ratio is 0.29%. AUM equal $520M and average daily trading volume around 419K shares. As of June 2012 the annual dividend yield was 5.42% and YTD return -7.76%. The 1 YR return was -30.37%. FEZ trades commission free at TD Ameritrade.
Note: FEU and FEZ seem the same and your eyes aren’t playing tricks on you. It’s an example of ETF sponsors covering all the bases so as to preempt competitors to the space. There are subtle differences in country weightings (France vs the UK for instance.)
Data as of June 2012
FEZ Top Ten Holdings & Weightings
- Total SA (FP): 6.26%
- Sanofi (SAN): 5.48%
- Siemens AG (SIE): 4.65%
- Basf SE (BFFAF): 4.20%
- Sap AG (0NW4): 3.48%
- Bayer AG (BAYN): 3.43%
- Eni SpA (ENI): 3.35%
- Anheuser-Busch Inbev SA (AHBIF): 3.30%
- Unilever NV DR (UNLNF): 3.20%
- Banco Santander SA (BCDRF): 3.16%
#3. iShares EMU ETF EZU

EZU follows the MSCI EMU Index which incorporates those countries within the European Monetary Union (EMU). The fund was launched in July 2000. The expense ratio is 0.54%. AUM equal $650M and average daily trading volume is 294K shares.
As of June 2012 the annual dividend yield was 4.45% and YTD return -5.20%. The 1 YR return was -29.86%.
Data as of June 2012
EZU Top Ten Holdings & Weightings
- Total SA (FP): 3.82%
- Sanofi (SAN): 3.20%
- Siemens AG (SIE): 2.89%
- Basf SE (BFFAF): 2.68%
- Anheuser-Busch Inbev SA (AHBIF): 2.25%
- Bayer AG (BAYN): 2.15%
- Sap AG (0NW4): 2.15%
- Unilever NV DR (UNLNF): 2.12%
- Telefonica SA (TEFOF): 2.02%
- Banco Santander SA (BCDRF): 1.99%
#2. iShares Europe 350 ETF IEV
IEV follows the S&P Europe 350 index which measures the largest 350 companies in Europe and the UK. The fund was launched in July 2000. The expense ratio is 0.60%. AUM equal $837M and average daily trading volume is 209K shares. As of June 2012 the annual dividend yield was 3.74% and YTD return -2.49%. The 1 YR return was -20.71%.
ProShares offer inverse and leveraged long/short ETFs for those wishing to hedge or speculate here.
Data as of June 2012
IEV Top Ten Holdings & Weightings
- Nestle SA (NSRGF): 3.36%
- Novartis AG (NVSEF): 2.56%
- HSBC Holdings PLC (HBCYF): 2.52%
- Vodafone Group PLC (VODPF): 2.41%
- BP PLC (BPAQF): 2.07%
- Royal Dutch Shell PLC (RYDAF): 2.02%
- GlaxoSmithKline PLC (GLAXF): 2.01%
- Roche Holding AG (RHHVF): 1.97%
- Total SA (FP): 1.81%
- British American Tobacco PLC (BATS): 1.67%
#1: Vanguard Europe ETF VGK
VGK follows the MSCI Europe Index which includes the largest weightings from 16 different European countries. The fund was launched in March 2005. The expense ratio is 0.14%. AUM equal $2.B and average daily trading volume is 1.8M shares. As of June 2012 the annual dividend yield was 4.73% and YTD return -1.91%. The 1 YR return was -20.05%. VGK trades commission free at TD Ameritrade and Vanguard.
Direxion Shares and ProShares offer inverse and leveraged long/short ETFs for those wishing to hedge or speculate here.
Data as of June 2012
VGK Top Ten Holdings & Weightings
- Nestle SA (NSRGF): 3.36%
- Novartis AG (NVSEF): 2.56%
- HSBC Holdings PLC (HBCYF): 2.52%
- Vodafone Group PLC (VODPF): 2.41%
- BP PLC (BPAQF): 2.07%
- Royal Dutch Shell PLC (RYDAF): 2.02%
- GlaxoSmithKline PLC (GLAXF): 2.01%
- Roche Holding AG (RHHVF): 1.97%
- Total SA (FP): 1.81%
- British American Tobacco PLC (BATS): 1.67%
We rank the top 10 ETF by our proprietary stars system as outlined below. However, given that we’re sorting these by both short and intermediate issues we have split the rankings as we move from one classification to another.
Strong established linked index
Excellent consistent performance and index tracking
Low fee structure
Strong portfolio suitability
Excellent liquidity

Established linked index even if “enhanced”
Good performance or more volatile if “enhanced” index
Average to higher fee structure
Good portfolio suitability or more active management if “enhanced” index
Decent liquidity


Enhanced or seasoned index
Less consistent performance and more volatile
Fees higher than average
Portfolio suitability would need more active trading
Average to below average liquidity


Index is new
Issue is new and needs seasoning
Fees are high
Portfolio suitability also needs seasoning
Liquidity below average


There isn’t as much to choose from in terms of indexes linked to ETFs from the European region. You’re seeing similar trends throughout and with the exception of the top 3 or 4 listed there is less liquidity than most would like.
It’s also important to remember that ETF sponsors have their own competitive business interests when issuing products which may not necessarily align with your investment needs. New ETFs from highly regarded and substantial new providers are also being issued. These may include Charles Schwab’s ETFs and Scottrade’s Focus Shares which both are issuing new ETFs with low expense ratios and commission free trading at their respective firms. These may also become popular as they become seasoned.
For further information about portfolio structures using technical indicators like DeMark and other indicators, take a free 14-day trial at ETF Digest. Follow us on Twitter and Facebook as well and join our group conversations.
For further information about portfolio structures using technical indicators like DeMark and other indicators see www.etfdigest.com. You may follow us on Facebook as well and join our group conversations.
You may address any feedback to: feedback@etfdigest.com
The ETF Digest has no current positions in any of the featured ETFs.
(Source for data is from ETF sponsors and various ETF data providers.)
Edge Rankings
Price Trend
© 2025 Benzinga.com. Benzinga does not provide investment advice. All rights reserved.
Trade confidently with insights and alerts from analyst ratings, free reports and breaking news that affects the stocks you care about.

