
Forget the ides of March, the first few days of the month are already proving eventful enough for the stock market. After the S&P 500 posted a healthy jump on March 1 to reach a new year-to-date high, the worm turned quickly the following Monday. Not only did the S&P 500 give up the majority of Friday’s gains, but CBOE’s volatility index experienced its most dramatic intraday spike of the year, jumping 25 percent in the first few hours of the day.
Although the VIX retreated somewhat from the morning’s surge, traders are clearly carrying more than their share of worries now that the S&P 500 is again flirting with a key 2,800 level. This is perhaps why the trading signals for low volatility ETFs on Quantamize, an investment research platform, were largely flashing “Buy” prior to Monday’s session.
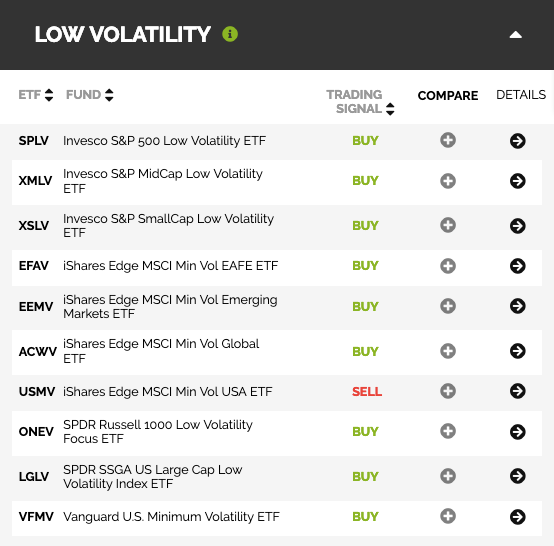
These smart beta signals, which gauge potential one-month ETF performance along growth, value, momentum, and volatility categories, provide a quick glimpse at which ETF structures the market is poised to reward. Compared to the other three categories, the Quantamize model is by far the most bullish on low volatility funds, while mostly bearish on a majority of growth and momentum ETFs.
We can get a more in-depth look at which low volatility funds have the highest performance potential by delving into the low volatility category of Quantamize’s Smart Beta Scores and Ratings.
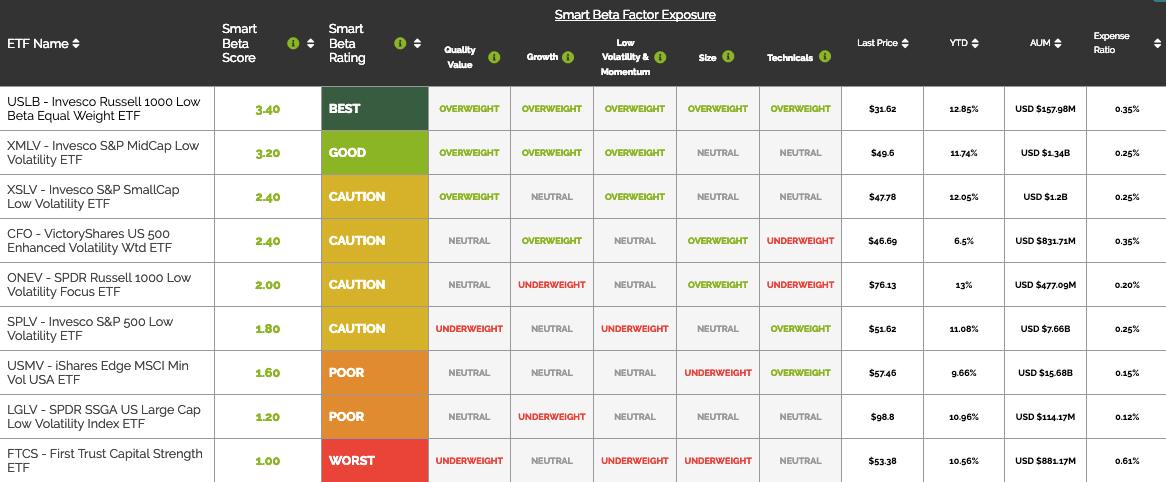
These rankings, updated every Monday, are sorted by their Smart-Beta Scores, which are generated by Quantamize’s proprietary AI multi-factor risk models. The models incorporate and synthesize fundamental and quantitative market signals along five primary criteria (quality value, growth, low volatility & momentum, size, and technicals) to inform each ETF’s overall score as well as their individual rank within each category.
Topping the chart of low volatility funds is the Invesco Russell 1000 Low Beta Equal Weight ETF USLB, which the model recommends being overweight based on all five of its metrics. On top of being the best-performing ETF of the low volatility lot year-to-date, it’s also among the smallest with just $157.98 million assets under management.
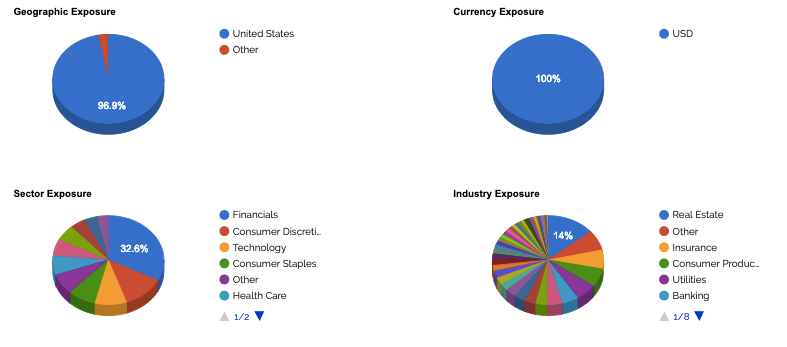
One of the reasons the model may be bullish USLB is the fund’s diverse allocation. Aside from a 32 percent allocation to financials, the fund is fairly equally allocated across the sectors. Among industries, real estate represents the largest allocation at 14 percent.
Today's Best Finance Deals
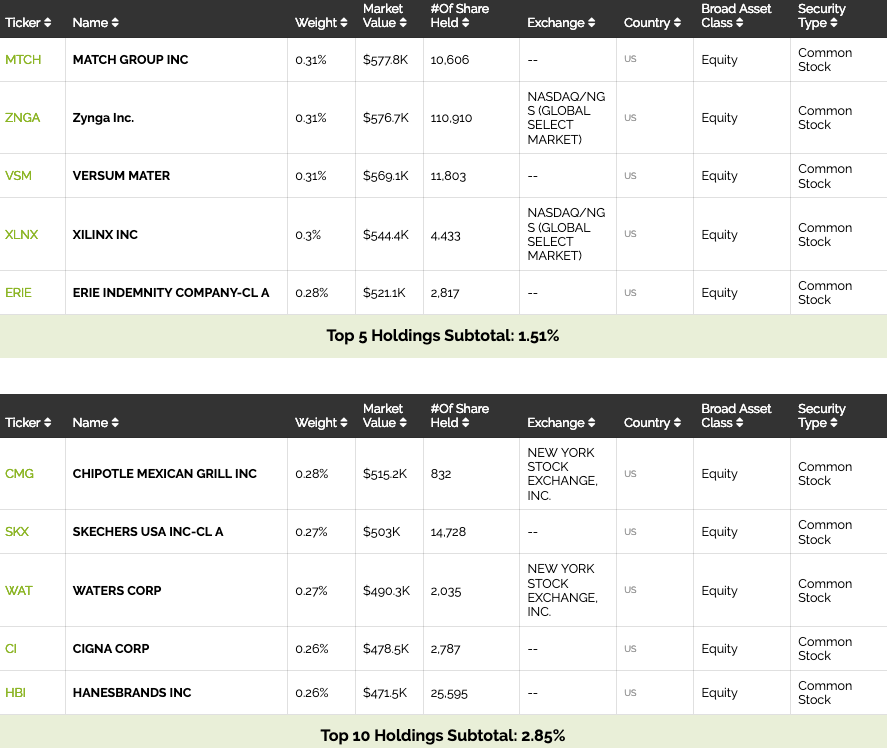
A further look at USLB’s individual holdings shows that USLB’s 10 largest positions account for less than 3 percent of the fund’s holdings.
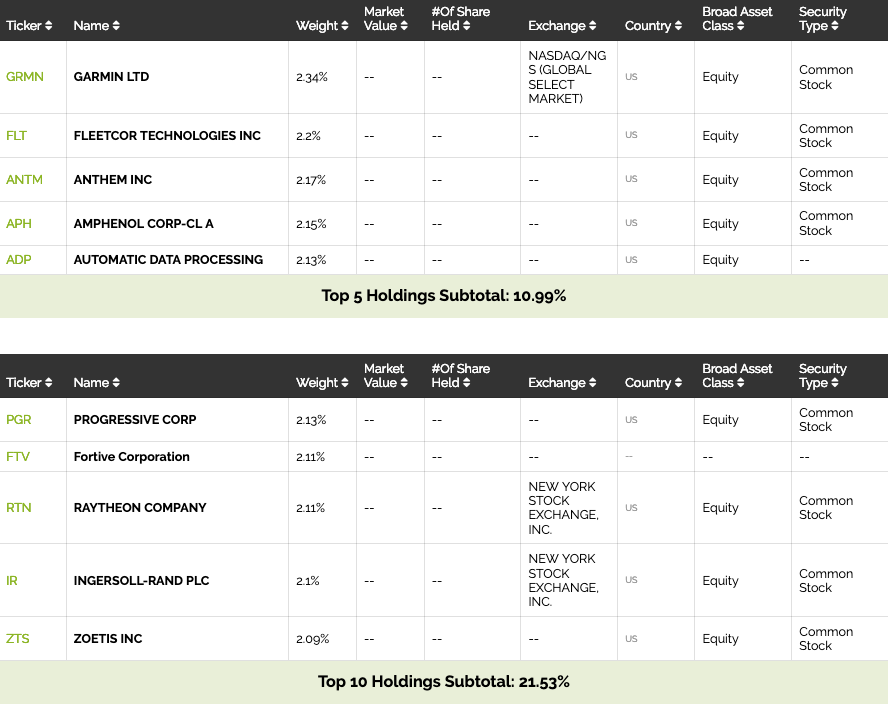
As a point of contrast, let’s take a look at First Trust Capital Strength ETF FTCS, which holds the lowest Smart Beta Score within the Low Volatility category.
Although its performance and AUM are both on par with others on the list, FTCS holds the worst expense ratio of the lot, indicating a low asset value relative to the fees investors are paying into the fund.
Critically, FTCS’s “underweight” rating in Quantamize’s volatility & momentum categories might be chalked up to its relatively high exposure to individual assets. Compared with USLB’s vast array of assets, FTCS’s top 10 holdings account for more than 20 percent of the fund.
Depending on how the rest of March plays out, investors might want to take their cue from these funds or explore the role one of them might play in their portfolio. Right now, signs are pointing to a choppy end to 2019’s first quarter.
Quantamize is a content partner of Benzinga
Edge Rankings
Price Trend
© 2025 Benzinga.com. Benzinga does not provide investment advice. All rights reserved.
Trade confidently with insights and alerts from analyst ratings, free reports and breaking news that affects the stocks you care about.

