
(Friday Market Close) Stocks sold off hard after May’s worrisome inflation report sent the S&P 500 (SPX) down 2.91% toward its monthly lows near 3,900. If SPX falls through this level, it will be in a full-fledged bear market. Other major indexes didn’t fare much better. The Nasdaq Composite ($COMP) plunged 3.52% and the Dow Jones Industrial Average ($DJI) tumbled 2.73%.
Behind the mayhem was May’s hotter-than-expected Consumer Price Index (CPI) data revealing that inflation had jumped a staggering 1% over the previous four weeks, exploding past analysts’ 0.7% forecasted increase and dwarfing April’s 0.3% gain.
Higher inflation spread across all metrics with gasoline, shelter, and food increases leading the way. The CPI energy index rose 3.9% over the month driven largely by gasoline prices rising 4.1% over the month. The home index increased 1.4% and the food index climbed 1.2%. Core inflation that excludes more volatile items like energy and food still climbed 0.6% in May compared to the expected 0.5%.
Many analysts were wondering by the close whether the Federal Reserve might bypass next week’s plan for a 50-basis-point rate hike and go higher.
Signs of a hoped-for inflation peak in today’s numbers were nowhere to be found. On an annual basis, inflation grew at 8.6% year-over-year well above the forecasted 8.3%. Annual core inflation came in at 6% instead of the projected 5.9%.
With inflation now at another 40-year high, the consumer is feeling real stress as real earnings—earnings adjusted for inflation—fell 3% for the month.
Further evidence came from the University of Michigan’s monthly consumer sentiment survey later in the day. The bellwether report slid to an all-time low in June of 50.2, well under a consensus reading of 59 reported earlier by the Wall Street Journal.
Digging into the report, the Michigan numbers, subject to later revision, reveal that consumers are particularly concerned about inflation continuing to rise. A possible reset in consumer spending as a result could be a reason why the consumer staples sector stayed in the green most of the day. But even essential consumer products weren’t immune from the selling into the close and ended the day in the red too.
Business confidence may also be eroding as the PHLX KBW Bank Index dove 4.34%. A weak consumer and higher borrowing costs are likely to reduce business investment, which translates into lower loan income for banks. Of course, we’ve also seen the housing market start to deteriorate in the last few months. Mortgage applications have declined in 12 of the last 15 weeks and are at about a third of what they were at their February 2021 peak.
The 10-year Treasury yield (TNX) spiked 12 basis points higher to 3.16%. The 2-year Treasury yield rose 23 basis points to 3.05%. The CME FedWatch Tool is now forecasting a high probability of a 50-basis point-hike at next week’s Fed meeting as well as in July, September, and November. The rising yields pushed risk asset lower with the Russell 2000 (RUT) falling 2.73% and S&P 500 Pure Growth Index tumbling 3.95%
The technology sector got pummeled from several sides with inflation, a weaker consumer, rising rates and Goldman Sachs (GS) analysts downgrading Netflix (NFLX), Roblox (RBLX), and eBay (EBAY) to a rarely used sell rating. Additionally, just-reported pandemic-related lockdowns in Beijing and Shanghai are likely to hurt technology production.
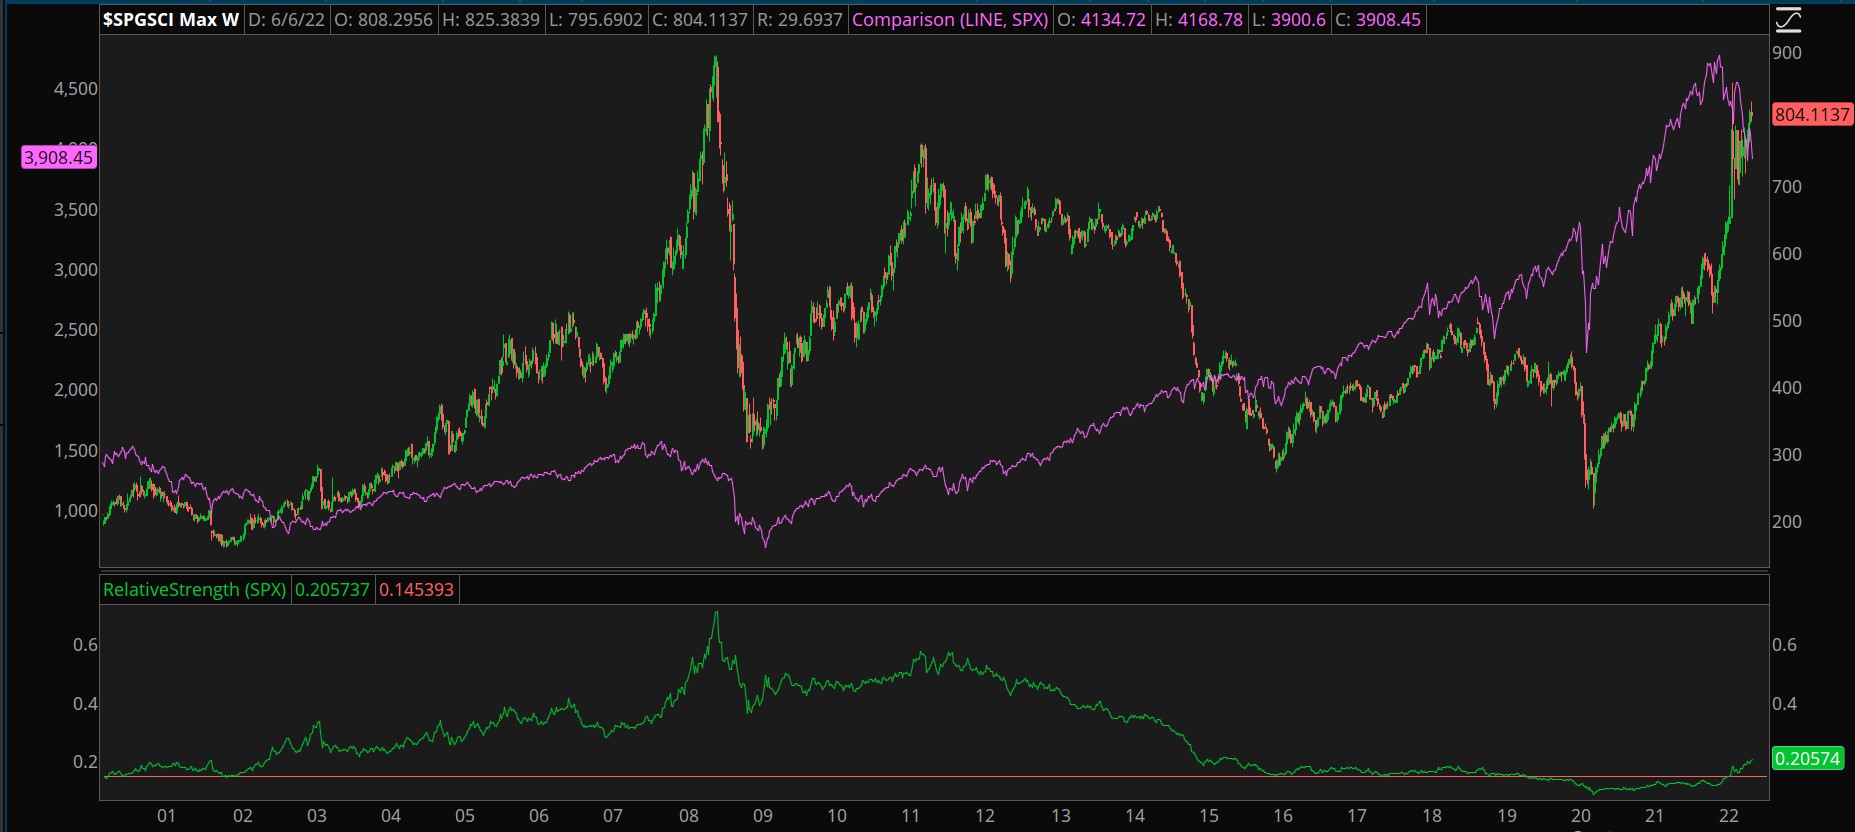
CHART OF THE DAY: SUPER CYCLE. The S&P GSCI ($SPGSCI—candlesticks) tracks a cross section of commodities. The S&P 500 (SPX—pink) fell more than 50% the last time commodities rose to these levels. In the last two years, the commodity index has demonstrated some relative strength (green) against the S&P 500. Data Sources: ICE, S&P Dow Jones Indices. Chart source: The thinkorswim® platform. For illustrative purposes only. Past performance does not guarantee future results.
Super Cycle
Today’s CPI report has people talking about the commodity super cycle again. This refers to a period when commodity prices rise and tend to weigh on economic growth. The last commodity super cycle took place during the 2000s and caused the S&P 500 (SPX) to stay below the 1,500 level from 2000 to 2013. Another super cycle took place in the 70s when the S&P 500 traded sideways for nearly two decades. Of course, this doesn’t mean that the S&P 500 will do the same this time around.
Jeff Currie, the Global Head of Commodities Research for Goldman Sachs, has identified three factors that could feed a commodity super cycle, including decarbonization or the focus on green energy, deglobalization, and decades of easy money policies. Until these issues are addressed, it’s likely commodity prices will rise, and inflation will continue to be an obstacle.
Notable Calendar Items
June 13: Earnings from Oracle (ORCL)
June 14: Producer Price Index (PPI)
June 15: Retail sales, FOMC Interest Rate Decision
June 16: Building permits, Housing starts, Philadelphia Fed Manufacturing Index and earnings from Adobe (ADBE), Kroger (KR)
June 21: Existing home sales
Image sourced from Unsplash
TD Ameritrade® commentary for educational purposes only. Member SIPC.
This post contains sponsored advertising content. This content is for informational purposes only and not intended to be investing advice.
© 2025 Benzinga.com. Benzinga does not provide investment advice. All rights reserved.
Trade confidently with insights and alerts from analyst ratings, free reports and breaking news that affects the stocks you care about.

