
AUD/USD Current Price: 0.7400
- The greenback resumed its advance after major pairs failed at critical levels.
- The Australian Trade Balance posted a surplus of A$12.24 billion in September.
- AUD/USD is technically bearish and there are no signs of bearish exhaustion.

The AUD/USD pair fell to 0.7382, holding around the 0.7400 mark at the end of the American session. Australian data released at the beginning of the day was upbeat, as the September Trade Balance posted a surplus of A$12.24 billion, beating the market’s expectations. Imports were down 2%, while exports decreased 6% when compared to the previous month. However, the pair entered a selling spiral during the European session amid the broad greenback’s strength.
The American currency recovered sharply as government bond yields head south, following the US Federal Reserve decision to start trimming its pandemic-related financial support. The market initially sold the dollar, but failure to break critical events triggered a U-turn in the US currency. Meanwhile, Wall Street ended the day mixed, with the DJIA and the Nasdaq down, adding pressure on the AUD.
Australia will publish the AIG Performance of Services Index for October, previously at 45.7, while the Reserve Bank of Australia will release the Statement of its monetary policy meeting.
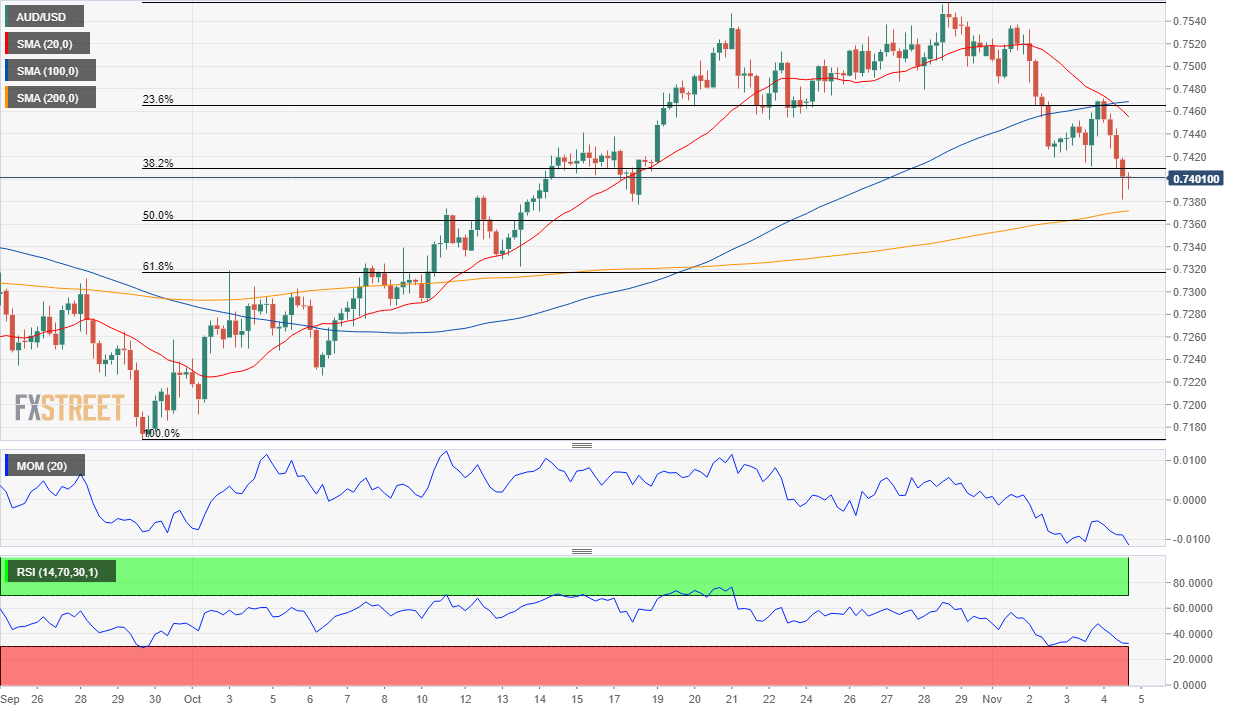
AUD/USD short-term technical outlook
The AUD/USD pair has broken below the 38.2% retracement of its 0.7169/0.7555 rally at around 0.7405, the immediate resistance level. The daily chart shows that the pair bounced modestly from a bearish 100 SMA, which converges with the daily low, as a flat 20 SMA acted as a dynamic resistance. Technical indicators are extending their declines within negative levels, hinting at further declines.
In the near term, and according to the 4-hour chart, the risk is also skewed to the downside. Technical indicators have stabilized well below their midlines, while the 20 SMA accelerated its decline below the 100 SMA, both above the current level. The next relevant support level is 0.7370, with a break below it favoring a decline towards the 0.7300 area.
Support levels: 0.7370 0.7330 0.7295
Resistance levels: 0.7405 0.7460 0.7500
© 2025 Benzinga.com. Benzinga does not provide investment advice. All rights reserved.
Trade confidently with insights and alerts from analyst ratings, free reports and breaking news that affects the stocks you care about.

