
The following post was written and/or published as a collaboration between Benzinga’s in-house sponsored content team and a financial partner of Benzinga.
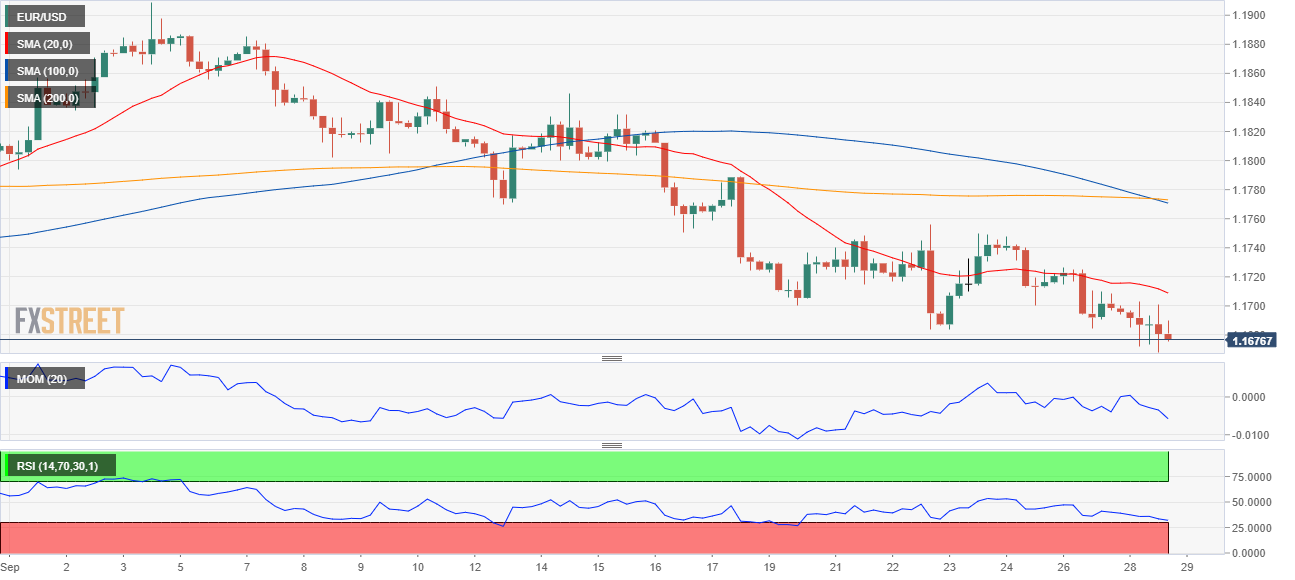
EUR/USD Current price: 1.1676
- ECB’s Lagarde and Fed’s Powell commented on inflation and monetary policy.
- Bottlenecks and supply disruptions spurred concerns and dumped the market’s mood.
- EUR/USD is technically bearish and could pierce the 1.1600 figure in the near term.

The EUR/USD pair trades at around 1.1680, ending a third consecutive day in the red. The pair traded as low as 1.1667 on the back of risk aversion, with the dismal sentiment easing ahead of Wall Street’s close. Generally speaking, concerns about global growth weighed on investors’ mood. Power blackouts in China and fuel shortages in the UK were among the main factors dumping sentiment.
Central banks’ leaders were on the wires. European Central Bank President Christine Lagarde noted that inflation expectations do not point to risks of prolonged overshooting, adding that the EU still needs an accommodative monetary policy stance. On the other hand, US Federal Reserve chief Powell said that “it's fair to say” inflation is more concerning than earlier this year, citing supply chain issues. He also repeated that they “have all but met” the test for tapering.
Data-wise, the US published the preliminary estimate of its August Trade Balance, which posted a deficit of $87.6 billion, while Wholesales Inventories in the same month increased 1.2%, worse than anticipated. Finally, the CB Consumer Confidence contracted to 109.3 from 115.2, missing expectations.
On Wednesday, the EU will release the September Economic Sentiment Indicator, foreseen at 116.9, while multiple ECB officials are scheduled to speak throughout the day. The US will publish August Pending Home Sales, while Fed’s chief Powell will repeat its testimony before a different commission.


EUR/USD short-term technical outlook
The EUR/USD pair is poised to extend its decline according to the daily chart and would likely accelerate its slump once below the year low. The daily chart shows that the 20 SMA has accelerated its decline above the current level and below the longer ones, which also head firmly lower.
In the near term, and according to the 4-hour chart, the bearish case is firmly in place. The pair is below bearish moving averages, with the 100 SMA about to cross below the 200 SMA. Also, technical indicators remain near oversold readings, without signs of downward exhaustion.
The 4-hour chart also offers a bearish stance, as the pair remains pressured near daily lows while below all of its moving averages. The Momentum indicator aims higher within negative levels, yet if the current candle closes in the red, it will likely resume its decline and align with the RSI, currently heading south and reflecting strong selling interest.
Support levels: 1.1660 1.1620 1.1570
Resistance levels: 1.1720 1.1755 1.1785
Image Sourced from Pixabay
The preceding post was written and/or published as a collaboration between Benzinga’s in-house sponsored content team and a financial partner of Benzinga. Although the piece is not and should not be construed as editorial content, the sponsored content team works to ensure that any and all information contained within is true and accurate to the best of their knowledge and research. This content is for informational purposes only and not intended to be investing advice.
© 2025 Benzinga.com. Benzinga does not provide investment advice. All rights reserved.
Trade confidently with insights and alerts from analyst ratings, free reports and breaking news that affects the stocks you care about.

