GBP/USD had an inconclusive end to last week. Daily price action looked indecisive as the pair came under strong selling pressure in the 1.3560 to 1.3640 zone. GBP/USD opened the week at 1.35340, then early on edged to a low of 1.34906, then floundered, with the pair eventually hitting a high of 1.3647, before strong selling led it to close at 1.35992.
GBP/USD weekly candle (w/e 11 February)


In terms of the daily setup, market structure still points to a continuation of the downtrend that has gripped the market since September last year. Price is confined between the 8 December swing low of 1.31610 and high of 1.37489. Furthermore, the pair after breaking above the 1.35740 - 61.8% Fib level of the last impulse and corrective move – failed to sustain on the retest and continues to bump up against the 200-EMA.
GBP/USD daily chart

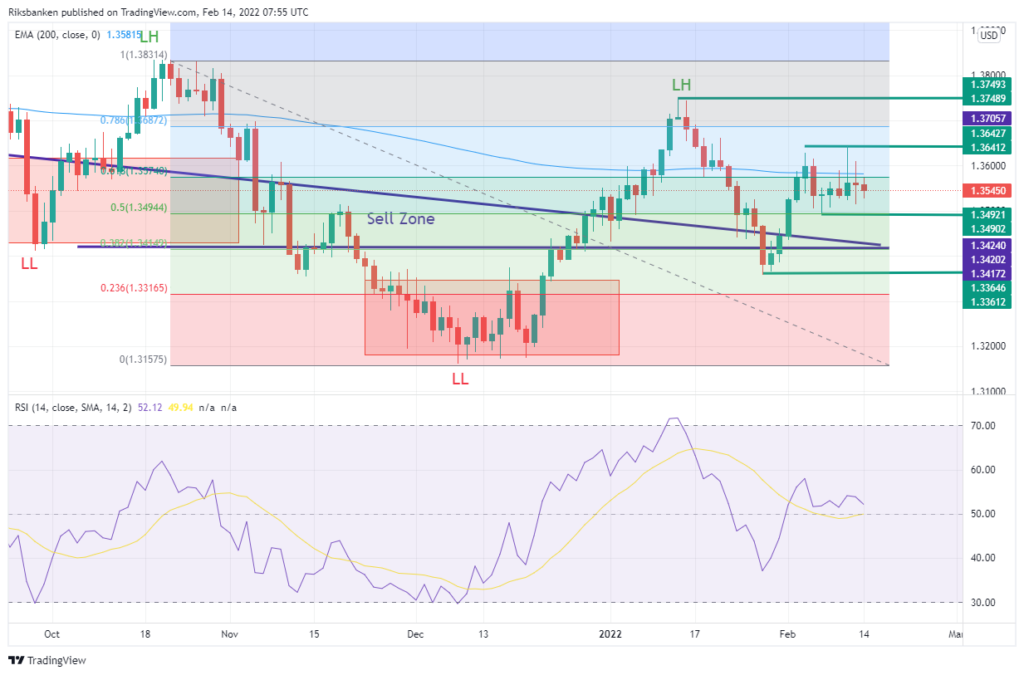
More recently, the pair has been trading in a range between 1.3612 and 1.34902. But a break higher above 1.37489 is needed to confirm any chance of a real shift in trend. While a fall back closer to 1.3433-1.34161, would put price back into a sell zone and would give greater confidence of a resumption of the downward trend.
© 2025 Benzinga.com. Benzinga does not provide investment advice. All rights reserved.
Trade confidently with insights and alerts from analyst ratings, free reports and breaking news that affects the stocks you care about.

