

Zinger Key Points
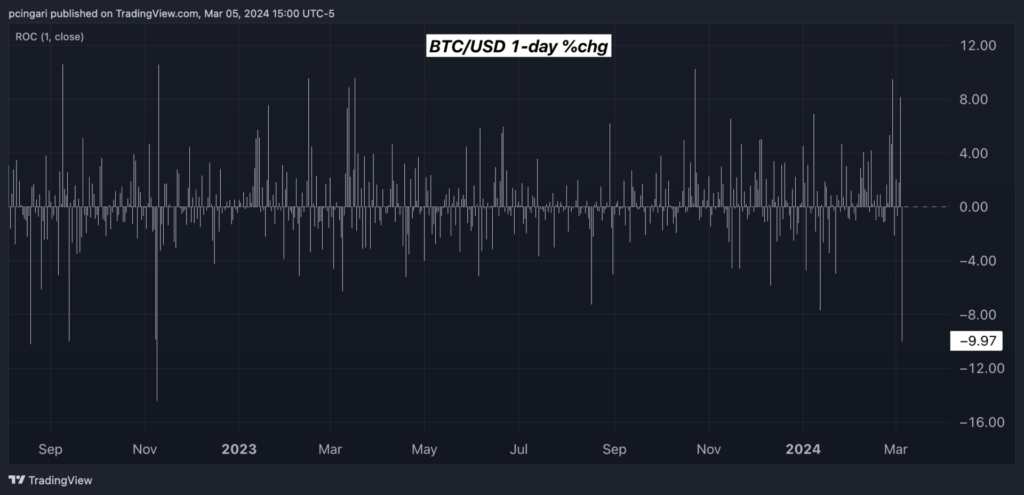
- Tuesday witnessed a turbulent ride for Bitcoin, initially reaching record highs above $69,000 before plummeting by 10%.
- Technical analysis of the BTC/USD daily chart reveals two potential patterns: a bearish engulfing candlestick and a bearish RSI divergence.
- Historic Summer Setup: 3 "Power Patterns" Triggering in the next 75 Days - Get The Details Now
Tuesday witnessed a Bitcoin-style rollercoaster, with the cryptocurrency initially soaring to new all-time highs surpassing $69,000, only to tumble by 10% at 3:00 p.m. ET, on track for its steepest daily decline since November 2022.
Among the swirling speculations surrounding this dramatic downturn—flash crash, market illiquidity, fat fingers, profit-taking behaviors, and more—no definitive explanation has emerged in the crypto community.
Yet, it’s possible that the truth is far more straightforward than the speculation indicates.
Bitcoin has been and will always be a high-risk investment, drawing investor flows during periods of bullish market sentiment. Historically, it has exhibited a strong correlation with tech stocks.
Thus, on a day when bearish sentiment grips Wall Street, the highly speculative segments of the market, including Bitcoin and other cryptocurrencies, tend to suffer disproportionately.
At the time of writing, the tech-heavy Nasdaq 100, tracked by the Invesco QQQ Trust QQQ, had plummeted by over 2%.
Chart: Bitcoin Eyes Worst-Performing Session Since Early November 2022


BTC/USD Technical Analysis
Technical signals emerging from the daily Bitcoin chart suggest two potential patterns:
- A bearish engulfing
- A bearish RSI divergence
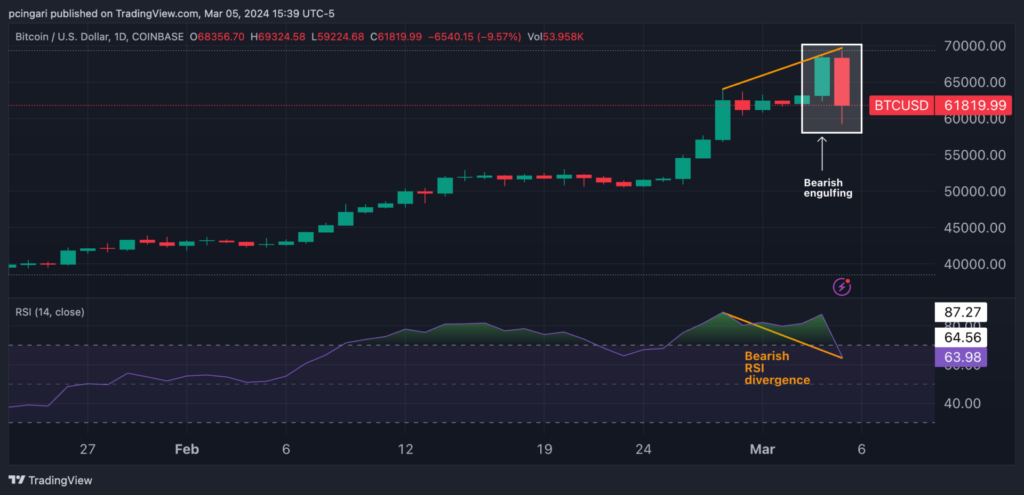
Bearish Engulfing Formation On BTC/USD Daily Chart
Today’s red candlestick fully engulfs the bullish candle from the previous day, unless bitcoin manages to close the session above $63,200. In essence, the bearish candle covers the entire price range of the preceding bullish candle.
Among traders, the bearish engulfing pattern is considered a robust signal, indicating a shift in market sentiment from bullish to bearish.
Traders often interpret this pattern as a signal to sell or take short positions, anticipating further downward movement in the asset’s price.
Bearish RSI Divergence On BTC/USD Daily Chart
Since Feb. 9, the Relative Strength Index (RSI) calculated on Bitcoin’s daily chart has consistently indicated overbought levels, with a brief exception from Feb. 22 to Feb. 25.
During the session in which the crypto reached a new all-time high, soaring to $69,324 on the Coinbase exchange at 10:00 a.m. ET Tuesday, the RSI is now exiting the overbought zone, indicating what is technically known as bearish RSI divergence.
Bearish divergence occurs when the price sets a new high in a session, but the strength of its upward movement is waning, signaling that buyers may be exhausted from pushing prices further upwards.
Read now: China’s 2024 Economic Targets Drive Wedge Between Domestic And Offshore Equities
Image created using artificial intelligence with Midjourney.
Edge Rankings
Price Trend
© 2025 Benzinga.com. Benzinga does not provide investment advice. All rights reserved.
Trade confidently with insights and alerts from analyst ratings, free reports and breaking news that affects the stocks you care about.

