
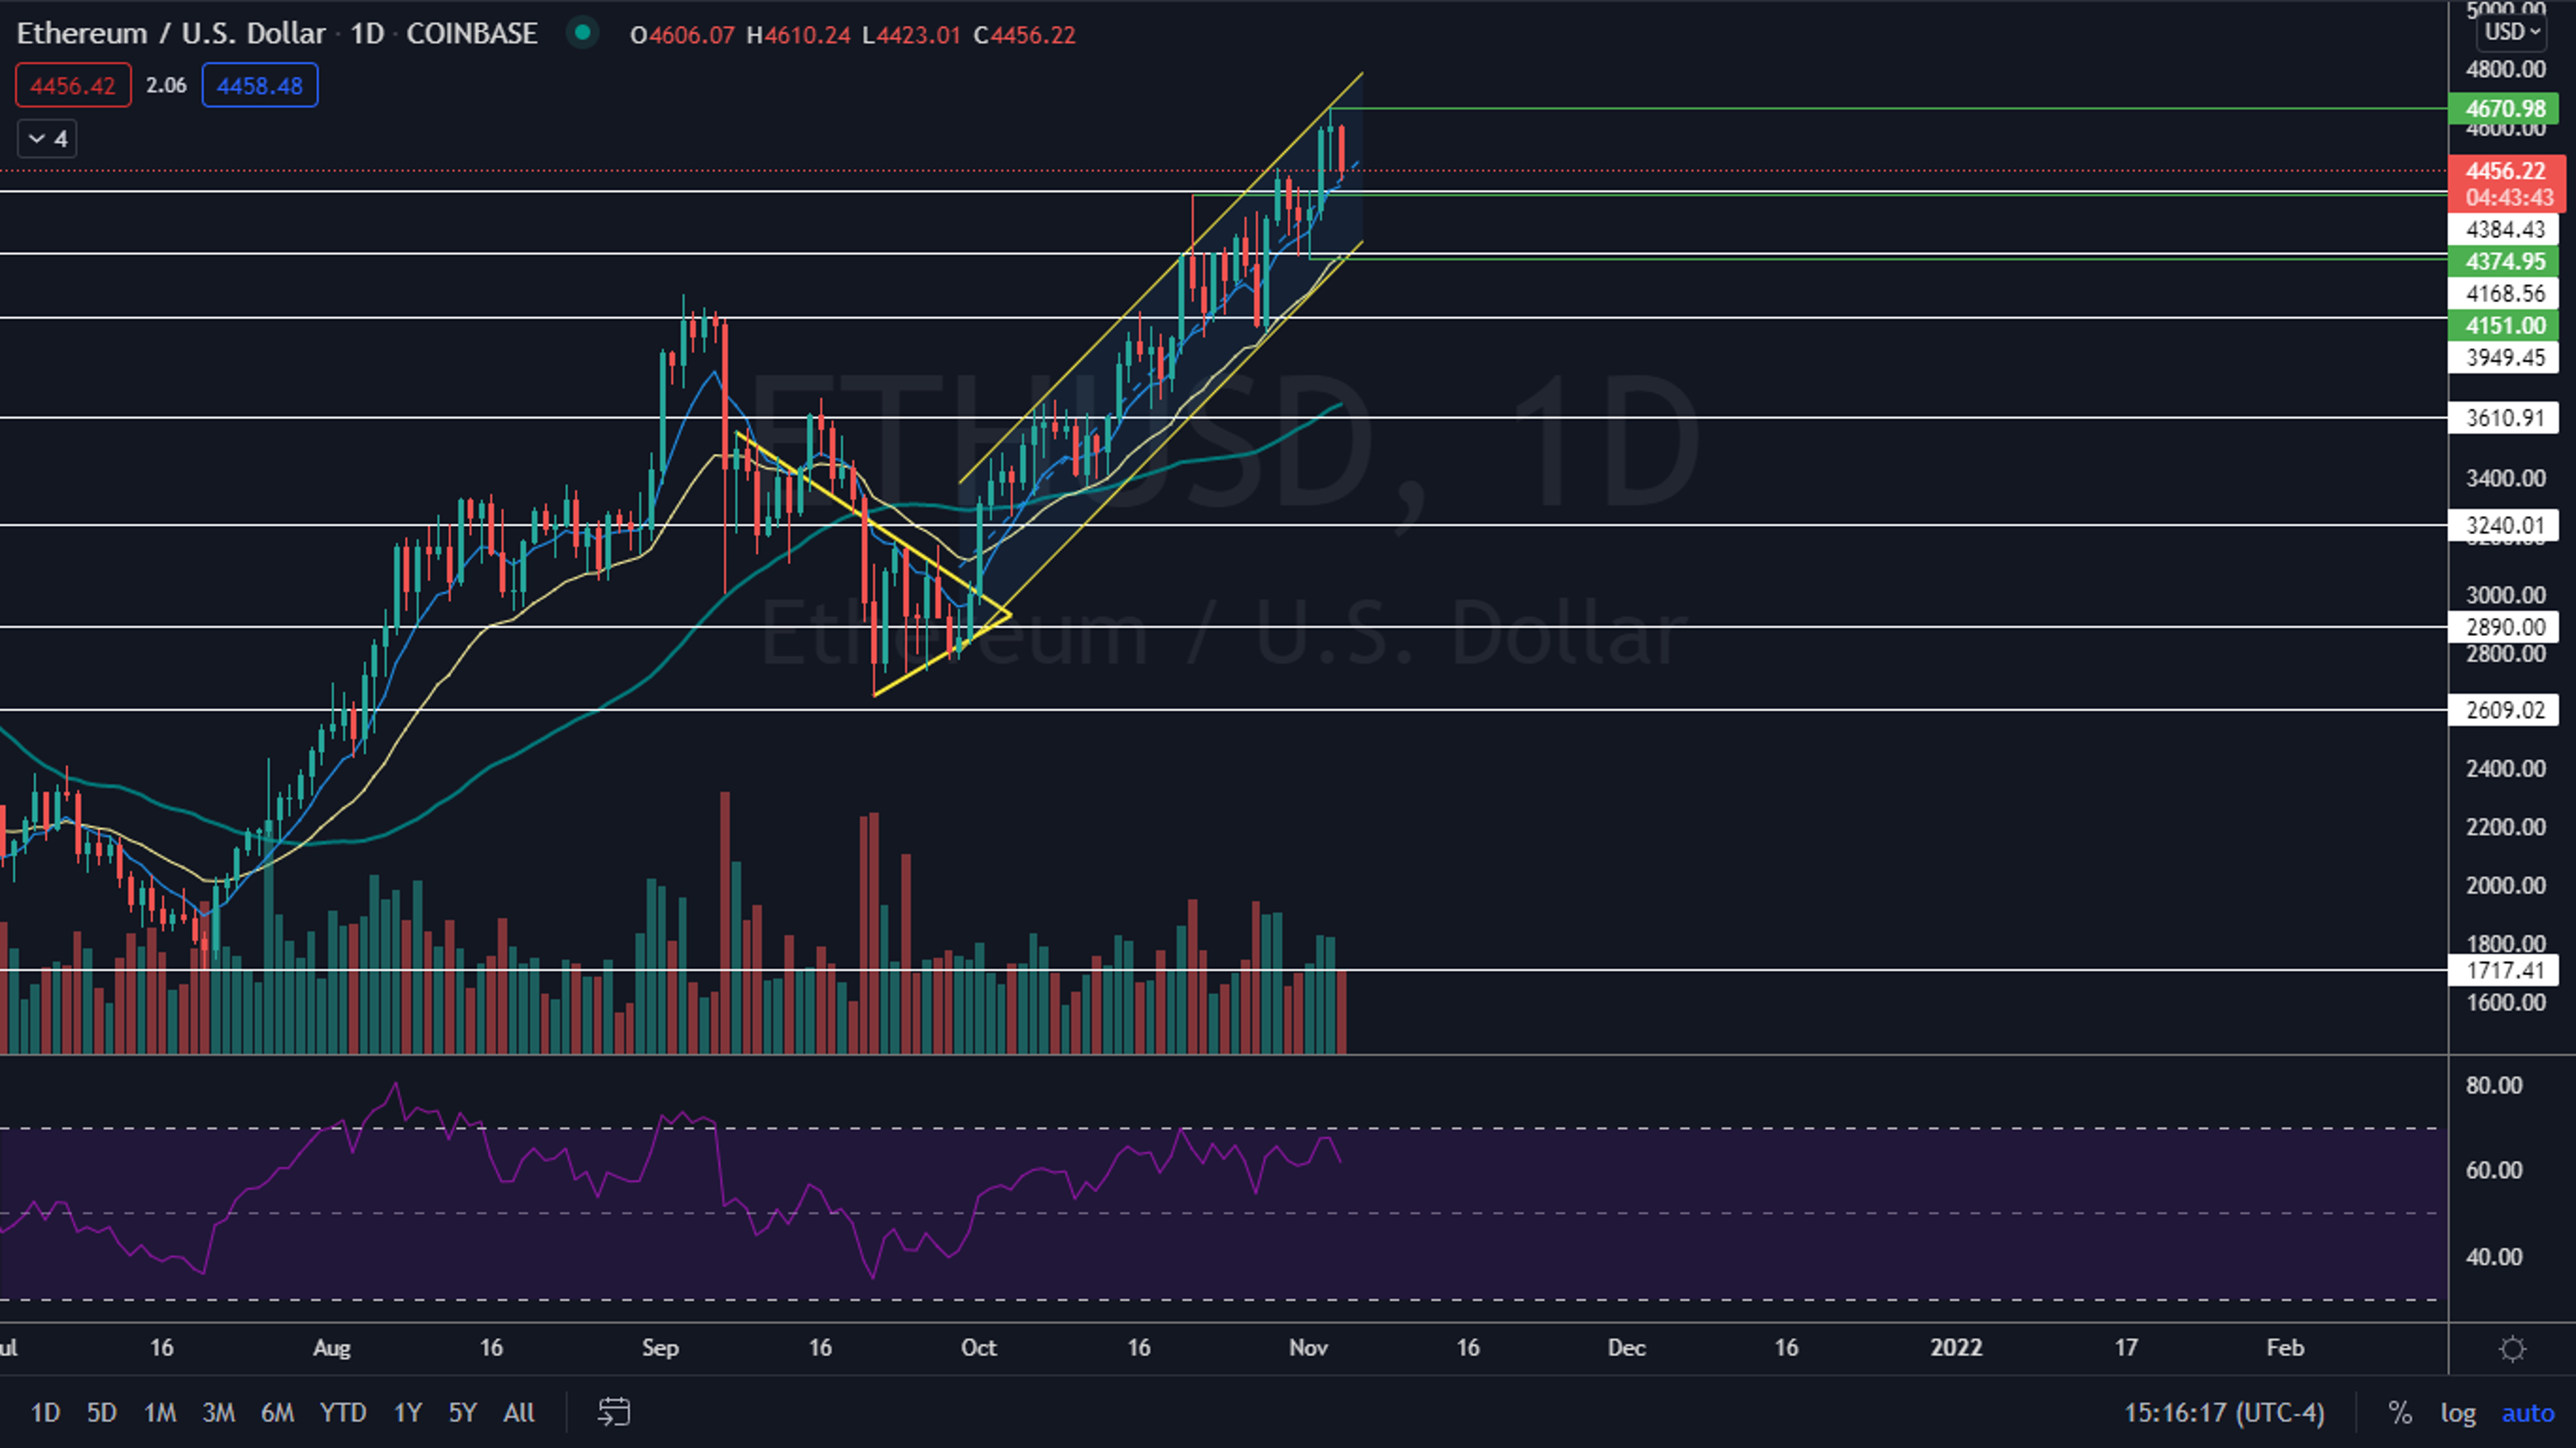
Ethereum (CRYPTO: ETH) was consolidating on Thursday after being unable to break up from a rising channel Benzinga pointed out on Oct. 29. The crypto has been showing strength and made a new all-time high on Wednesday, despite Bitcoin (CRYPTO: BTC) remaining unable to trade back toward its all-time high of $66,999.
Although Ethereum has usually taken a back seat to Bitcoin, the interest in Ethereum has grown due to the popularity of the NFTs, which are secured by the Ethereum blockchain.
On Tuesday, Ethereum reached an all-time high hash rate of over 766.4 Gigahash per second, coinciding with the new all-time high made on that day as well. Hash rate is a reflection of the performance of mining hardware and the all-time high indicates miners are increasing their hardware’s ability to perform.
See Also: How to Buy Ethereum • Step by Step
The Ethereum Chart: Ethereum reversed course into an uptrend on Sept. 26 and has since made a consistent series of higher highs and higher lows on the 24-hour chart between a parallel channel. The upper ascending trendline of the channel has been acting as resistance while the lower ascending trendline has been acting as support.
Ethereum’s most previous higher high was printed at all-time highs while the most recent higher low was created on Oct. 31 and Nov. 1 when the crypto hit and bounced from the $4,374.95 level. Because Ethereum hit and wicked from the level on two separate days, a bullish double bottom pattern was created, which helped the crypto to soar higher over the following two days.
On Wednesday, when Ethereum was unable to break up from the channel, sellers came in and exited their positions, which caused the crypto to wick from the upper trendline and fall lower. On Thursday, Ethereum tested support at the median line of the channel and bounced up slightly, which indicates buyers came in and bought the dip.
The slightly lower prices are needed to cool Ethereum’s relative strength index (RSI), which hit the 68% level on Wednesday, when a stock or crypto’s RSI nears or reaches the 70% level it becomes overbought, which can be a sell signal for technical traders. On Thursday, the selling pressure allowed Ethereum’s RSI to cool off to about 62%.
Ethereum is trading above the eight-day and 21-day exponential moving averages (EMAs) with the eight-day EMA trending above the 21-day, both of which are bullish indicators. The crypto has been mostly riding up the eight-day EMA since Oct. 1, which indicates the eight-day is a key support area.
- Bulls want to see big bullish volume come into Ethereum to push it up to make a new all-time high, which will confirm that the uptrend remains intact. Above that high, the only other area of resistance comes at the top of the channel.
- Bears want to see big bearish volume drop Ethereum down through the bottom of the rising channel, which will negate the uptrend. Ethereum has support below at $4,384 and $4,168.

Want direct analysis? Find me in the BZ Pro lounge! Click here for a free trial.
Photo by Executium on Unsplash
© 2025 Benzinga.com. Benzinga does not provide investment advice. All rights reserved.