
Cryptocurrencies Bitcoin (CRYPTO:BTC), Litecoin (CRYPTO:LTC) and Dogecoin (CRYPTO:DOGE) may all offer profitable trading opportunities.
Markets are either in equilibrium or not. If they are, the price doesn’t change. If they aren’t, there could be big moves ahead and short-term traders can profit.
One way to tell if a security is overextended is the use of statistics and probability theory.
They say 95% of all trading should be within two standard deviations of the mean. If it has exceeded this threshold, there is a good chance there will be a reversion to the average.
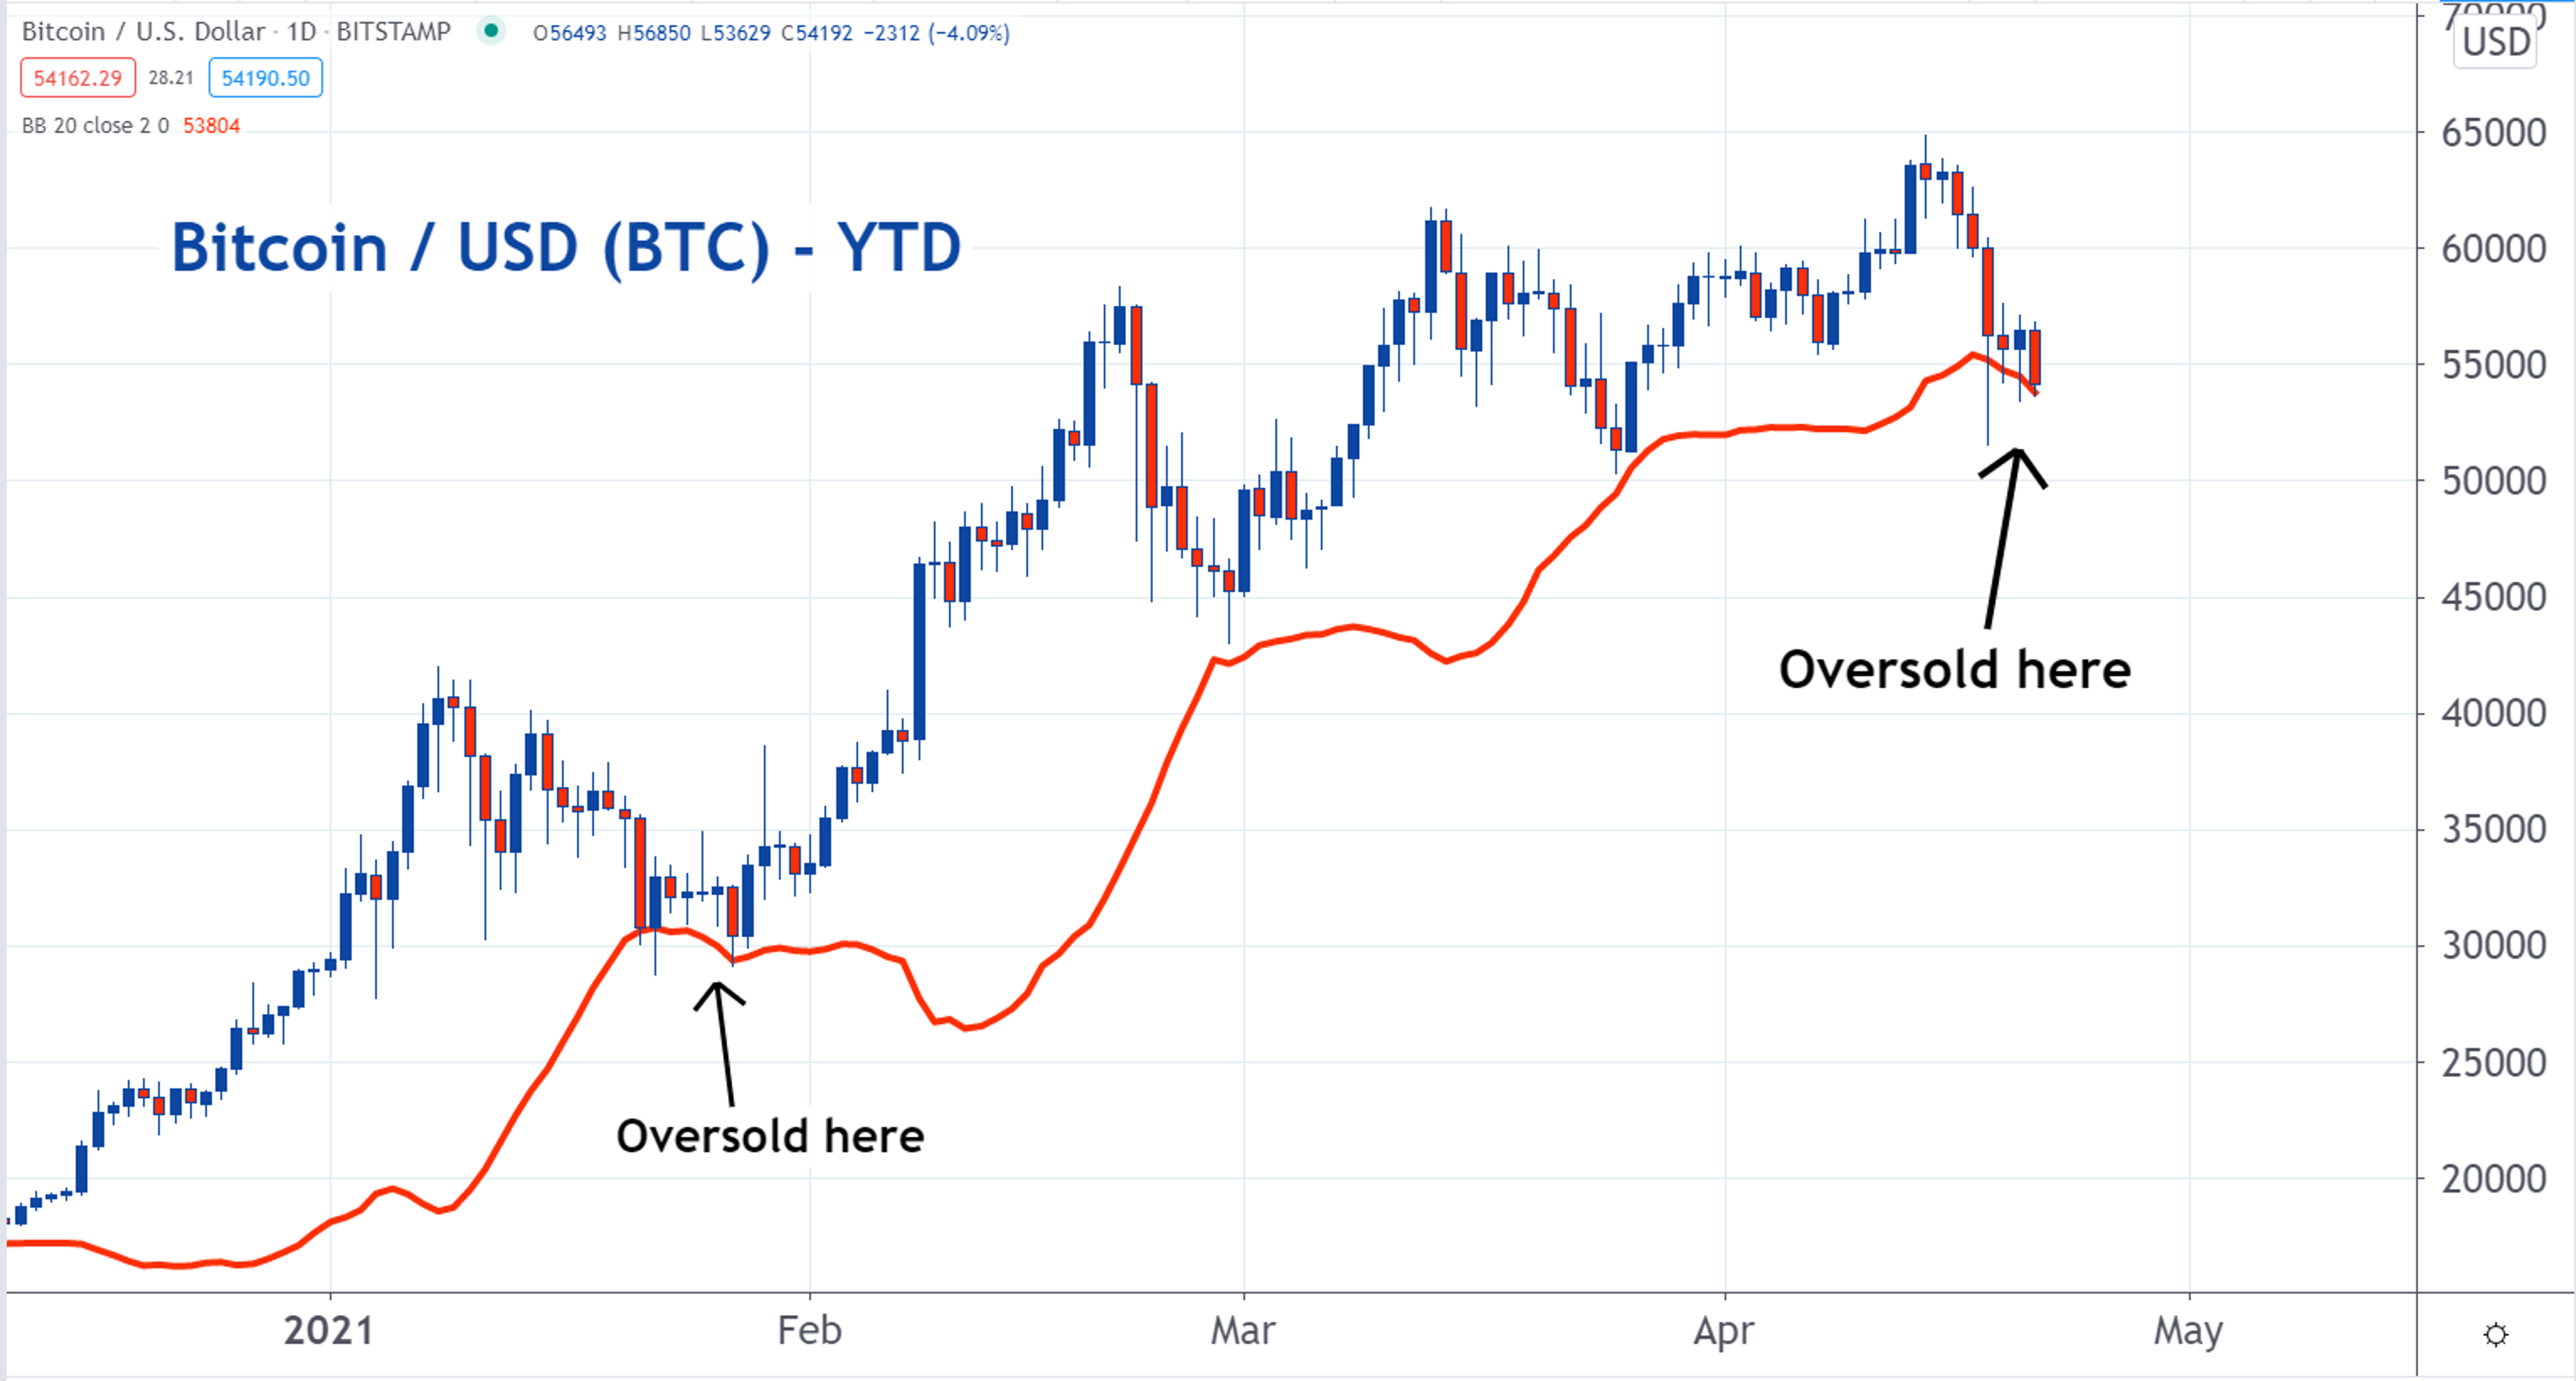
On the following chart, the red line is two standard deviations below the 20-day average price of Bitcoin. It's now below this threshold, which will make some traders buy BTC. They will be expecting a return to the average. This means a rally.
See Also: Best Cryptos Right Now?

Another thing short-term traders will look for is important price levels.
When markets are selling off, some traders will buy when the markets reach a level that had previously been resistance. They will be anticipating a conversion of the former resistance level into support. This could put an end to the selloff and may even cause a rally to start.
Resistance turns into support because of seller’s remorse.
This happens because many of the investors who sold their Litecoin at $235 thought they made the right decision when it traded lower, but then it rallied and is now trading above this price.
Many of these investors now believe they made a mistake. A number of them decide to buy the stock back, but they also decide they will only do so if they can get it for the same price they sold at. This will allow them to erase their mistake.
As a result, buy orders are placed at a level that had previously been resistance. This will form support. If there are enough of these buy orders, the level will turn into a support level.
That’s what happened with the $235 level for LTC.


A third thing traders will look for is a change in the trend.
When markets are rallying, the bulls have control. When they're selling off, the bears are in charge.
A reversal pattern on a chart is an illustration of a change in this leadership. One of these patterns has formed on the chart of Dogecoin.
On the chart below, the vertical blue rectangles show up days. The red ones are days that are down.
The bulls were in charge as Dogecoin rallied from 5 cents to 40 cents. On Tuesday, Dogecoin began the day at 41 cents, trended lower over the day, and ended it at 33 cents.
This big move could mean the bears have taken control from the bulls. This type of action shows up on a chart as a reversal pattern and that’s the case here. Traders will be expecting a selloff.


© 2025 Benzinga.com. Benzinga does not provide investment advice. All rights reserved.