
The following is a contributed article from a content partner of Benzinga
Altcoin prices have been on an absolute tear since the infamous Black Thursday Bitcoin crash that pulled BTC price down to $3,750 occurred on March 12.
An uncountable number have strongly outperformed Bitcoin price and recently crypto-media has been abuzz, mystified by a the collective of decentralized finance (DeFi) related tokens which have rallied hundreds to thousands of percent.
The growing popularity of yield farming, total value locked in each protocol and lucrative interest rates on crypto lending all appear to be the primary catalysts for the DeFi rally.
As these surges occurred, Bitcoin’s dominance rate has decreased and while low-cap altcoins have seen upward movement, larger cap altcoins have lagged behind Bitcoin price and smaller cap altcoins.
Bitcoin and Ethereum Market Cap (Dominance). Source: CoinMarketCap
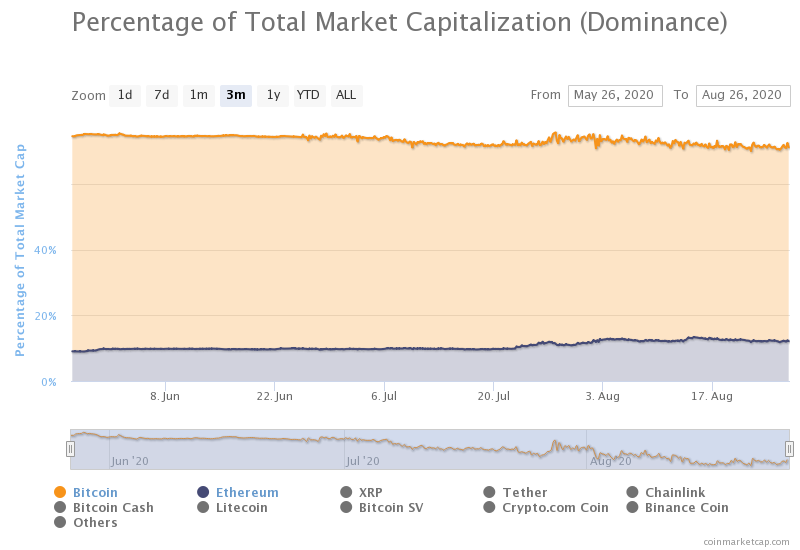
Ethereum and Cardano have stood out as exceptions to this phenomenon. But as investors will recall, the likes of Chainlink and Band have strongly outperformed and snatched the ranking from a number of large cap altcoins.
Analysts at on-chain data firm Santiment have predicted that when the DeFi hype dies down or a long overdue correction comes to the sector, a significant amount of these funds will shift back into Bitcoin and a few larger cap altcoins.
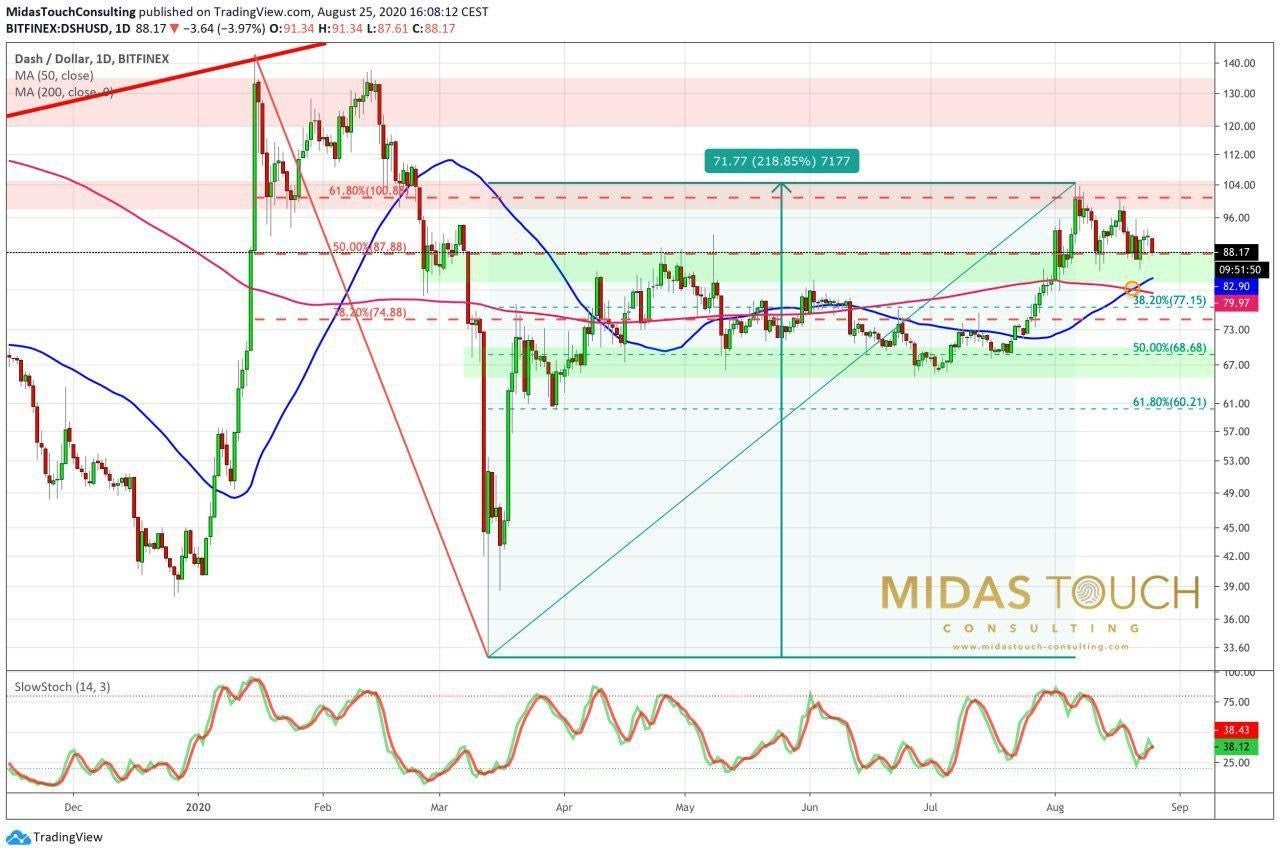
One of the larger-cap altcoins that might benefit from this pivot is Dash. As shown on the daily chart below, the digital asset recently completed a golden cross between the 50 and 200-day moving averages on August 19.
Dash/USD daily chart. Source: TradingView
According to Quantum Economics founder and CEO Mati Greenspan, "A golden cross is generally seen to be a bullish signal for technical analysts. Of course, as with anything that happens on the charts, we are looking at historic data and so only gives us insights about the potential possibilities of what might happen in the future."
A tell that signaled a strong upside move from many altcoins was the convergence of the 100 and 200-day moving averages, a step which is on the verge of occurring with Dash.
In private comments Florian Grummes, the founder of Midas Touch Consulting said, "DASH so far has recovered pretty much exactly 61.8% of the sell-off that had started in mid of February with a top above $130 and led to a crash down to around $33 within the following four weeks. In early August, about 220% higher at around $100 the typical 61.8% Fibonacci retracement stopped the DASH bulls. Hence, should BTC continue to pull back, DASH could already become a low risk long in that zone. But keep in mind that markets often retrace at least around one third of the prior move."
Looking forward
Although things are shaping up nicely for the DASH/USDT pair, there are a few areas of concern that investors should consider. The digital asset has yet to break the pattern of lower highs and lower lows on the daily and 4-hour timeframe.
There is also a descending trendline extending from the local high ($105) and in addition to pushing above the 20-MA. While the golden cross on the daily timeframe is an encouraging signal, it is not an absolute confirmation that Dash will enter a bullish uptrend.
Grommes said that “it certainly strengthens the sound zone support between $80 and $83”, but traders are cautioned to not open positions solely based on this one maneuver.
Dash/USD 4-hour chart. Source: TradingView
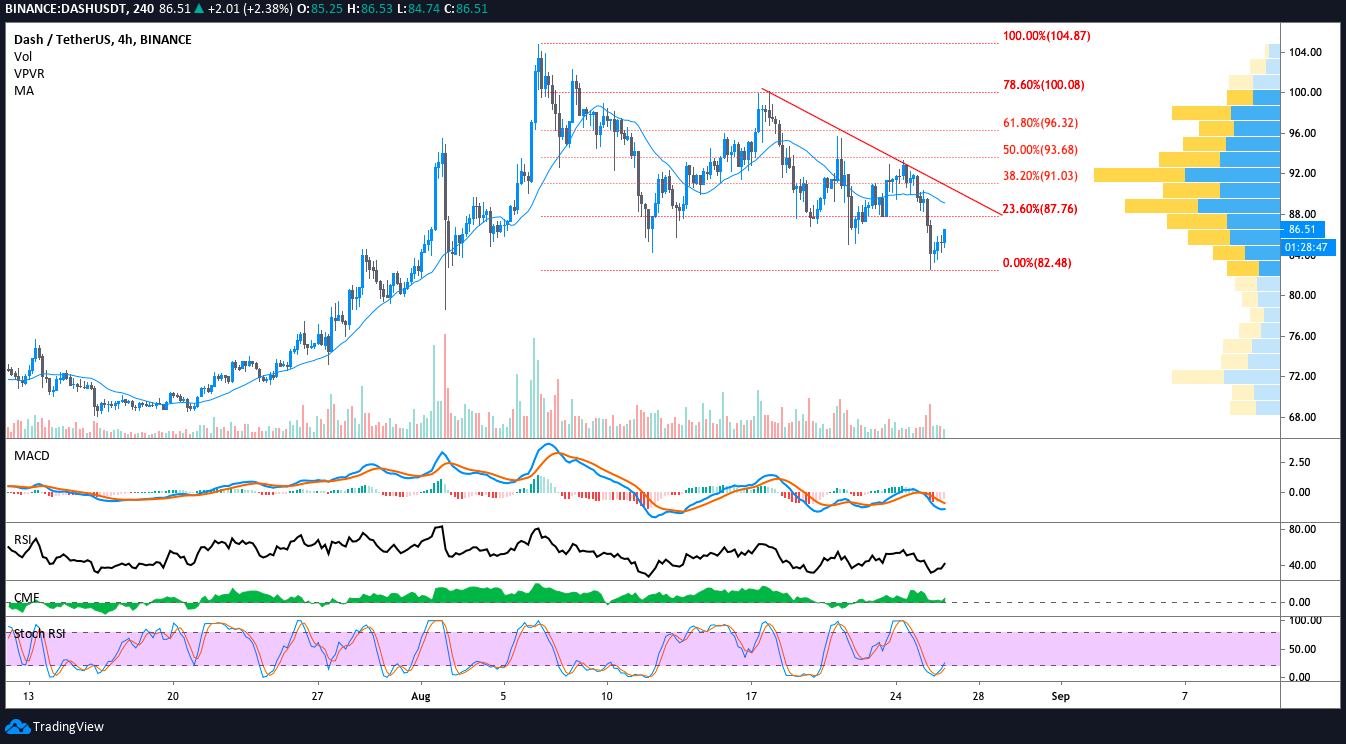
Dash price would provide clearer bullish confirmation if both levels of resistance at the 20-MA and descending trendline were broken. The volume profile visible range indicator also shows a high-volume node at $90.90-$92.25 which aligns with the 20-MA and the descending trendline.
While the 4-hour Stoch RSI and moving average convergence divergence are beginning to pull up from oversold territory, purchasing volume has yet to eclipse sell volume so risk averse traders may consider waiting for the bullish confirmation signals listed above.
Traders who rely on technical analysis indicators will likely desire to see a convergence of the signal line and MACD on the 4-hour or daily moving average convergence divergence. The RSI is also below the midline and breakout above the 50 level would provide some proof that Dash is regaining bullish momentum.
Patient traders who are extremely risk averse might consider waiting for the price to find support above the 38.20% ($91.03) and 50% ($93.68) Fibonacci retracement levels before opening fresh positions.
Disclaimer: the writer does not hold any DASH at the time this article was published. This article is meant to be educational. Please discuss with your financial adviser before purchasing any cryptocurrencies as they are high-risk.
Image Source: Forextime
© 2025 Benzinga.com. Benzinga does not provide investment advice. All rights reserved.