
- Constantinople's arrival is delayed due to security breaches.
- Possible increases in the short term seem to value the news positively.
- Very powerful upward structures are suggested.
As if we were on a permanent "Groundhog Day," we are dawning today at the same levels that we have intermittently frequented since mid-December. Monday's "Bump" failed to secure the advances and went back yesterday to the first available support.
That's what it looks like, but looking closely at the indicators we can see that today can be a special day. Today is a day in which the market has before it an optimal scenario for a new bullish start, although equally optimal to cancel the advances and withdraw in search of a new accumulation zone deep enough in the price scale so that the offer is exhausted.
The Ethereum development community has announced early in the morning that Constantinople, the expected update of the Ethereum network in detecting vulnerabilities has been delayed. As we read in the blog of Ethereum.org:
Out of an abundance of caution, key stakeholders around the Ethereum community have determined that the best course of action will be to delay the planned Constantinople fork that would have occurred at block 7,080,000 on January 16, 2019.
This will require anyone running a node (node operators, exchanges, miners, wallet services, etc...) to update to a new version of Geth or Parity before block 7,080,000. Block 7,080,000 will occur in approximately 32 hours from the time of this publishing or at approximately January 16, 8:00 pm PT / January 16, 11:00 pm ET / January 17, 4:00 am GMT.
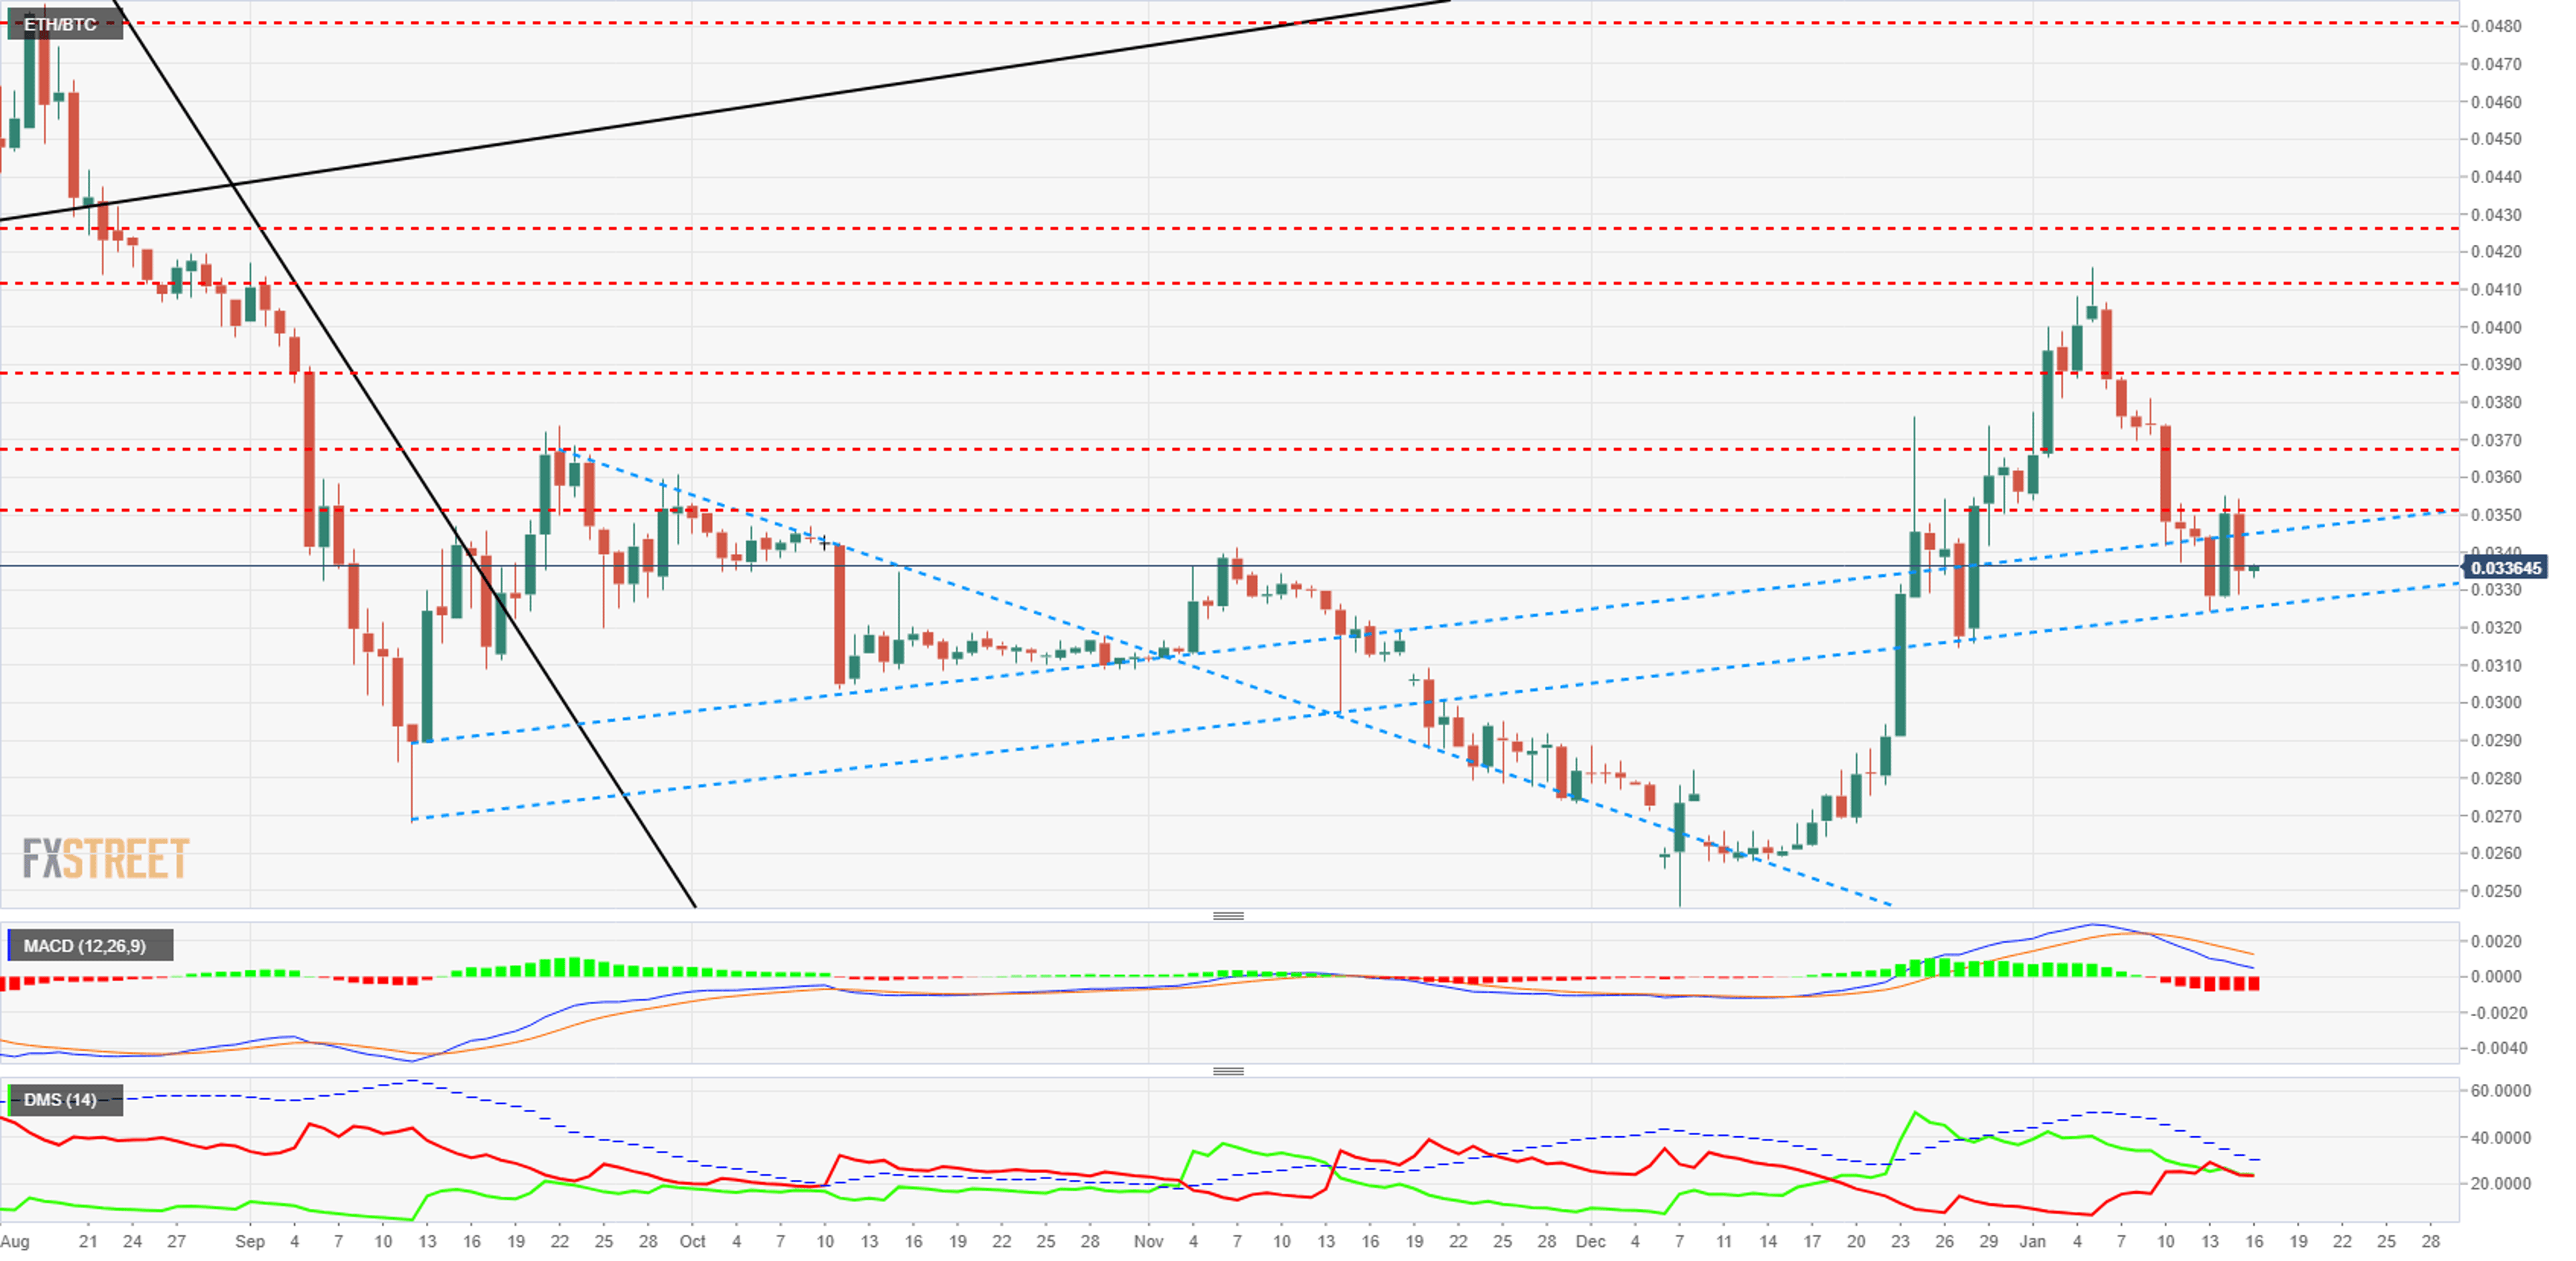
ETH/BTC Daily Chart

BTC/USD 240 Minute Chart
The BTC/USD on the 4-hour chart confirms what I predicted yesterday as a possible scenario and returns to the $3,600 level. The highlight of the analysis is to see the SMA200 with a bullish profile. This setup is not trivial, as the slowest of the simple averages is also the most inertial and influential.
Above the current price, the first target is $3,700 (price congestion resistance and EMA50), a level that seems to be on track as I write this article. The destination point is not natural since at $3,734 is the second resistance level (SMA200) and at $3,777 expects a third resistance with the SMA100.
Below the current price, the first support is at $3,600 (price congestion support). The second support level is at $3,470 (price congestion support). Finally, the third level of support is at $3,320 (price congestion support). There is very little mystery about the lower end of the stage.

The MACD in the 4-hour range shows how the fast line tries to bounce upward after touching the slow average. It is a compelling structure in the short term although it is usually the beginning of divergent movements.
The DMI in the range of 4 hours shows the bears losing strength while the bulls take a strong bullish inclination. The structure ensures gains in the short term.
ETH/USD 240 Minute Chart
The ETH/USD in the range of 4 hours shows an identical structure to the one we just analyzed in the BTC/USD pair. For Ethereum the first resistance level is $127.9 (SMA200). The simple average of 200 periods shows an outstanding bullish inclination. The second resistance level is at $130 (price congestion resistance and EMA50). Finally, the third resistance level is at $142 (price congestion resistance and SMA100).
Below the current price, the first support for ETH/USD is at $120 (price congestion support). The second level of support is at $115 (price congestion support). The third level of support is at $110 (price congestion support).

The MACD on a 4-hour chart shows a small delay concerning the BTC/USD MACD. If the day ends with price increases, the upside potential will be huge.
The DMI on the 4-hour chart shows the bears retreating with the same force with which the bulls advance. The structure keeps a strong bullish potential.
XRP/USD 240 Minute Chart
The XRP/USD is trading at the $0.331 price level after a first failed attempt to break the first resistance level at $0.334 (price congestion resistance). The second resistance level is at $0.34 (EMA50). The third resistance level is at $0.354 (SMA200 and SMA100). I also see in the case of the XRP how the slower average shows an optimistic bullish profile. The XRP/USD pair is the one with the most freedom to have no moving average above.
Below the current price, the first support level is $0.32 (price congestion support). The second support level is $0.308 (price congestion support). The third support level is $0.296 (price congestion support).

The MACD on the 4-hour chart shows a bullish profile after the fast average tested the slow average level. It is a powerful bullish structure which, over time, tends to end up in divergent structures.
The 4-hour DMI chart shows the most advanced structure among the Top 3 of the crypto-board. Bears and bulls move at the same level of trend force and as resolved will give us clues as to what may happen in the cases of Bitcoin or Ethereum.
© 2025 Benzinga.com. Benzinga does not provide investment advice. All rights reserved.

